
|
Syrma SGS Technology Limited (Syrma.ns) تقييم DCF |
Fully Editable: Tailor To Your Needs In Excel Or Sheets
Professional Design: Trusted, Industry-Standard Templates
Investor-Approved Valuation Models
MAC/PC Compatible, Fully Unlocked
No Expertise Is Needed; Easy To Follow
Syrma SGS Technology Limited (SYRMA.NS) Bundle
سواء كنت مستثمرًا أو محللًا ، فإن حاسبة DCF (Syrmans) هذه هي أداة الانتقال إلى التقييم الدقيق. محملة بالبيانات الحقيقية من Syrma SGS Technology Limited ، يمكنك ضبط التوقعات ومراقبة التأثيرات في الوقت الفعلي.
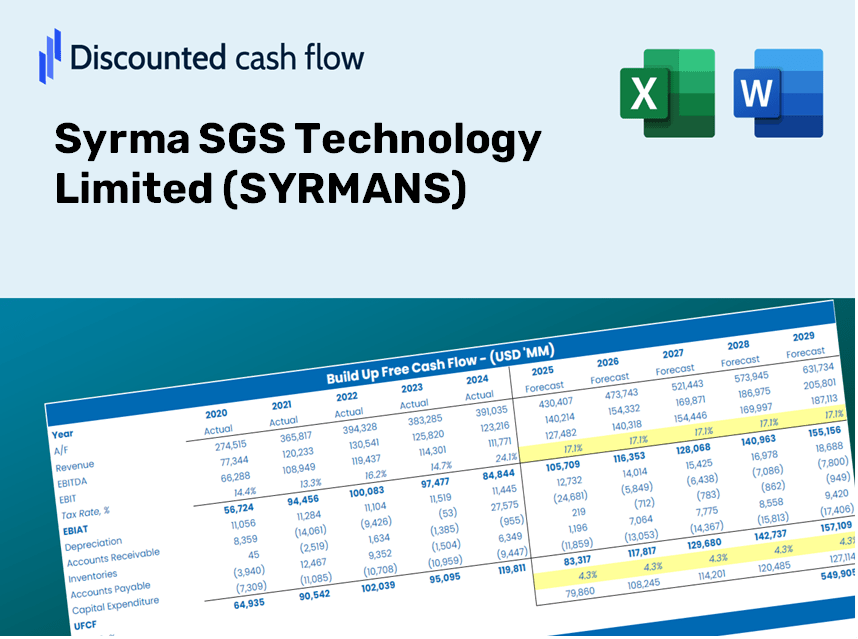
Discounted Cash Flow (DCF) - (USD MM)
| Year | AY1 2021 |
AY2 2022 |
AY3 2023 |
AY4 2024 |
AY5 2025 |
FY1 2026 |
FY2 2027 |
FY3 2028 |
FY4 2029 |
FY5 2030 |
|---|---|---|---|---|---|---|---|---|---|---|
| Revenue | 4,383.0 | 10,197.2 | 20,483.9 | 31,541.2 | 37,866.9 | 63,809.1 | 107,524.1 | 181,187.9 | 305,317.8 | 514,488.0 |
| Revenue Growth, % | 0 | 132.65 | 100.88 | 53.98 | 20.06 | 68.51 | 68.51 | 68.51 | 68.51 | 68.51 |
| EBITDA | 451.9 | 921.3 | 1,823.9 | 1,942.8 | 2,855.9 | 5,353.7 | 9,021.4 | 15,201.9 | 25,616.6 | 43,166.2 |
| EBITDA, % | 10.31 | 9.03 | 8.9 | 6.16 | 7.54 | 8.39 | 8.39 | 8.39 | 8.39 | 8.39 |
| Depreciation | 105.1 | 167.7 | 254.4 | 430.0 | 603.4 | 1,051.7 | 1,772.2 | 2,986.3 | 5,032.2 | 8,479.8 |
| Depreciation, % | 2.4 | 1.64 | 1.24 | 1.36 | 1.59 | 1.65 | 1.65 | 1.65 | 1.65 | 1.65 |
| EBIT | 346.8 | 753.6 | 1,569.5 | 1,512.8 | 2,252.5 | 4,302.0 | 7,249.2 | 12,215.6 | 20,584.3 | 34,686.5 |
| EBIT, % | 7.91 | 7.39 | 7.66 | 4.8 | 5.95 | 6.74 | 6.74 | 6.74 | 6.74 | 6.74 |
| Total Cash | 1,068.4 | 697.1 | 1,245.3 | 1,141.1 | 3,471.5 | 6,390.9 | 10,769.2 | 18,147.0 | 30,579.3 | 51,528.9 |
| Total Cash, percent | .0 | .0 | .0 | .0 | .0 | .0 | .0 | .0 | .0 | .0 |
| Account Receivables | 1,408.1 | 2,781.3 | 4,098.0 | 9,625.2 | 14,774.6 | 19,007.6 | 32,029.5 | 53,972.7 | 90,948.8 | 153,256.9 |
| Account Receivables, % | 32.13 | 27.28 | 20.01 | 30.52 | 39.02 | 29.79 | 29.79 | 29.79 | 29.79 | 29.79 |
| Inventories | 1,788.8 | 2,913.0 | 5,874.4 | 10,042.6 | 8,218.7 | 19,346.8 | 32,601.1 | 54,935.8 | 92,571.8 | 155,991.8 |
| Inventories, % | 40.81 | 28.57 | 28.68 | 31.84 | 21.7 | 30.32 | 30.32 | 30.32 | 30.32 | 30.32 |
| Accounts Payable | 1,902.5 | 2,404.5 | 4,894.8 | 12,232.4 | 15,743.9 | 21,853.4 | 36,824.9 | 62,053.2 | 104,565.2 | 176,201.8 |
| Accounts Payable, % | 43.4 | 23.58 | 23.9 | 38.78 | 41.58 | 34.25 | 34.25 | 34.25 | 34.25 | 34.25 |
| Capital Expenditure | -193.8 | -904.8 | -1,184.0 | -3,376.8 | -2,365.4 | -4,597.8 | -7,747.7 | -13,055.5 | -21,999.7 | -37,071.5 |
| Capital Expenditure, % | -4.42 | -8.87 | -5.78 | -10.71 | -6.25 | -7.21 | -7.21 | -7.21 | -7.21 | -7.21 |
| Tax Rate, % | 28.35 | 28.35 | 28.35 | 28.35 | 28.35 | 28.35 | 28.35 | 28.35 | 28.35 | 28.35 |
| EBITAT | 279.4 | 501.6 | 1,048.0 | 975.5 | 1,614.0 | 3,011.7 | 5,075.1 | 8,551.9 | 14,410.8 | 24,283.5 |
| Depreciation | ||||||||||
| Changes in Account Receivables | ||||||||||
| Changes in Inventories | ||||||||||
| Changes in Accounts Payable | ||||||||||
| Capital Expenditure | ||||||||||
| UFCF | -1,103.7 | -2,230.9 | -1,669.4 | -4,328.9 | 37.9 | -9,786.0 | -12,205.1 | -20,566.7 | -34,656.8 | -58,399.8 |
| WACC, % | 4.78 | 4.73 | 4.73 | 4.72 | 4.75 | 4.74 | 4.74 | 4.74 | 4.74 | 4.74 |
| PV UFCF | ||||||||||
| SUM PV UFCF | -113,482.5 | |||||||||
| Long Term Growth Rate, % | 4.00 | |||||||||
| Free cash flow (T + 1) | -60,736 | |||||||||
| Terminal Value | -8,181,102 | |||||||||
| Present Terminal Value | -6,489,323 | |||||||||
| Enterprise Value | -6,602,806 | |||||||||
| Net Debt | 3,688 | |||||||||
| Equity Value | -6,606,494 | |||||||||
| Diluted Shares Outstanding, MM | 178 | |||||||||
| Equity Value Per Share | -37,026.03 |
ماذا ستتلقى
- البيانات المالية الأصيلة Syrmans: الوصول إلى البيانات التاريخية والمتوقعة للتقييم الدقيق.
- المعلمات القابلة للتخصيص: اضبط WACC ومعدلات الضرائب ونمو الإيرادات والنفقات الرأسمالية حسب الحاجة.
- الحسابات في الوقت الحقيقي: الحسابات الفورية للقيمة الجوهرية و NPV في أطراف أصابعك.
- تقييم السيناريو: استكشف سيناريوهات مختلفة لتقييم الإمكانات المستقبلية لتكنولوجيا Syrma SGS Limited.
- واجهة سهلة الاستخدام: مصمم للمهنيين ، ولكن من السهل بما يكفي للقادمين الجدد للتنقل.
الميزات الرئيسية
- وصول شامل للبيانات: البيانات المالية التاريخية والتنبؤات التفصيلية ل Syrma SGS Technology Limited (Syrmans).
- المعلمات القابلة للتخصيص: اضبط WACC ، ومعدلات الضرائب ، ونمو الإيرادات ، وهامش الأرباح قبل الفوائد والضرائب والإهلاك والاستهلاك لتناسب تحليلك.
- الحسابات في الوقت الحقيقي: مراقبة إعادة معايرة القيمة الجوهرية لـ Syrma على الفور.
- التصورات البديهية: تقدم مخططات لوحة القيادة نتائج التقييم بشكل فعال والمقاييس الأساسية.
- مصمم للدقة: أداة قوية مصممة للمحللين والمستثمرين والمهنيين الماليين.
كيف تعمل
- الخطوة 1: قم بتنزيل ملف Excel.
- الخطوة 2: فحص بيانات SYRMA SGS Technology Limited (SYRMANS) المليئة (التاريخية والمتوقعة).
- الخطوة 3: تعديل الافتراضات الرئيسية (المبرمة باللون الأصفر) استنادًا إلى رؤيتك.
- الخطوة 4: راقب عمليات إعادة حساب الأوتوماتيكية لقيمة Syrma SGS Technology Limited (Syrmans).
- الخطوة 5: الاستفادة من نتائج اتخاذ قرارات الاستثمار أو لأغراض الإبلاغ.
لماذا تختار هذه الآلة الحاسبة؟
- بيانات موثوقة: توفر البيانات المالية الدقيقة من Syrma SGS Technology Limited (Syrmans) نتائج تقييم جديرة بالثقة.
- تجربة مصممة: تعديل المعلمات الأساسية مثل معدلات النمو ، WACC ، ومعدلات الضرائب لتتماشى مع توقعاتك.
- فعال: توفر لك الحسابات المدمجة متاعب البدء من الألف إلى الياء.
- أداة على مستوى الخبراء: مصممة للمستثمرين والمحللين والمستشارين على حد سواء.
- سهل الاستخدام: تضمن واجهة سهلة الاستخدام وتوجيهات خطوة بخطوة إمكانية الوصول لجميع المستخدمين.
من يمكنه الاستفادة من هذا المنتج؟
- المستثمرون: تقييم القيمة العادلة لتكنولوجيا Syrma SGS Limited (Syrmans) بدقة قبل اتخاذ خيارات الاستثمار.
- المدير المالي: الاستفادة من نموذج DCF من الدرجة الأولى لتقارير وتحليل مالي دقيق.
- الاستشاريون: تخصيص القالب بسهولة لتقارير تقييم العميل.
- رواد الأعمال: اكتساب رؤى قيمة في ممارسات النمذجة المالية للشركات الرائدة.
- المعلمون: توظيفها كمورد لتوضيح تقنيات التقييم في الفصل الدراسي.
ما يحتويه القالب
- البيانات التاريخية: يوفر شاملة overview من Syrma SGS Technology Limited (Syrmans) الأداء المالي والتوقعات التأسيسية.
- نماذج DCF و Ruvered DCF: قوالب متعمقة مصممة لتقييم القيمة الجوهرية لتكنولوجيا Syrma SGS Limited (Syrmans).
- ورقة WACC: مقاييس محسوبة مسبقًا لمتوسط تكلفة رأس المال المرجح.
- مدخلات قابلة للتحرير: تخصيص برامج التشغيل الأساسية مثل نسب النمو وهامش الأرباح قبل الفوائد والضرائب والإهلاك والاستهلاك وافتراضات الإنفاق الرأسمالي.
- البيانات الفصلية والسنوية: تحليل واسع النطاق للبيانات المالية لـ Syrma SGS Technology Limited (Syrmans).
- لوحة القيادة التفاعلية: التواصل مع التصورات الديناميكية لنتائج التقييم والتوقعات.
Disclaimer
All information, articles, and product details provided on this website are for general informational and educational purposes only. We do not claim any ownership over, nor do we intend to infringe upon, any trademarks, copyrights, logos, brand names, or other intellectual property mentioned or depicted on this site. Such intellectual property remains the property of its respective owners, and any references here are made solely for identification or informational purposes, without implying any affiliation, endorsement, or partnership.
We make no representations or warranties, express or implied, regarding the accuracy, completeness, or suitability of any content or products presented. Nothing on this website should be construed as legal, tax, investment, financial, medical, or other professional advice. In addition, no part of this site—including articles or product references—constitutes a solicitation, recommendation, endorsement, advertisement, or offer to buy or sell any securities, franchises, or other financial instruments, particularly in jurisdictions where such activity would be unlawful.
All content is of a general nature and may not address the specific circumstances of any individual or entity. It is not a substitute for professional advice or services. Any actions you take based on the information provided here are strictly at your own risk. You accept full responsibility for any decisions or outcomes arising from your use of this website and agree to release us from any liability in connection with your use of, or reliance upon, the content or products found herein.