
|
Valoración de DCF Syrma SGS Technology Limited (SYRMA.NS) |
Completamente Editable: Adáptelo A Sus Necesidades En Excel O Sheets
Diseño Profesional: Plantillas Confiables Y Estándares De La Industria
Predeterminadas Para Un Uso Rápido Y Eficiente
Compatible con MAC / PC, completamente desbloqueado
No Se Necesita Experiencia; Fáciles De Seguir
Syrma SGS Technology Limited (SYRMA.NS) Bundle
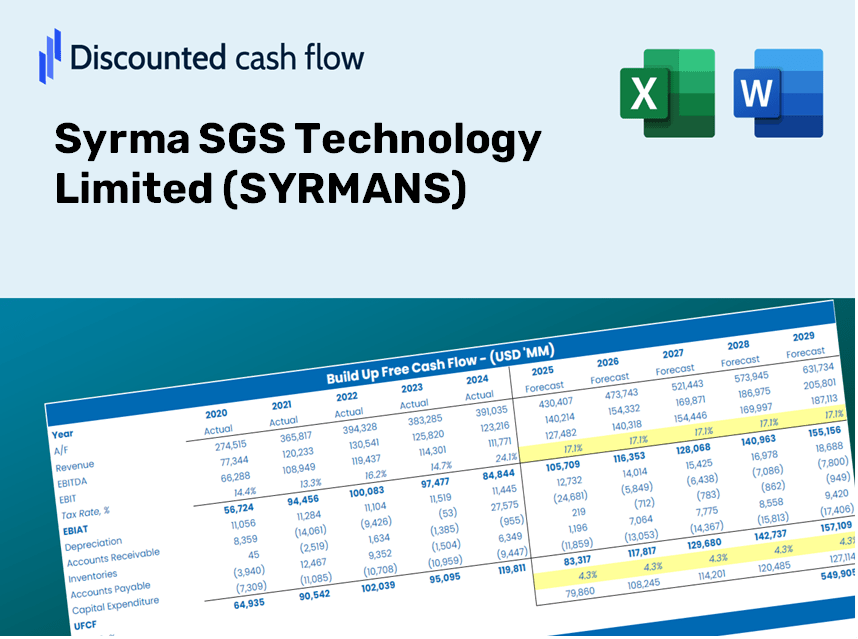
Ya sea que sea un inversionista o un analista, esta calculadora DCF (Syrmans) es su herramienta de referencia para una valoración precisa. Cargados con datos reales de Syrma SGS Technology Limited, puede ajustar los pronósticos y observar los efectos en tiempo real.
Discounted Cash Flow (DCF) - (USD MM)
| Year | AY1 2021 |
AY2 2022 |
AY3 2023 |
AY4 2024 |
AY5 2025 |
FY1 2026 |
FY2 2027 |
FY3 2028 |
FY4 2029 |
FY5 2030 |
|---|---|---|---|---|---|---|---|---|---|---|
| Revenue | 4,383.0 | 10,197.2 | 20,483.9 | 31,541.2 | 37,866.9 | 63,809.1 | 107,524.1 | 181,187.9 | 305,317.8 | 514,488.0 |
| Revenue Growth, % | 0 | 132.65 | 100.88 | 53.98 | 20.06 | 68.51 | 68.51 | 68.51 | 68.51 | 68.51 |
| EBITDA | 451.9 | 921.3 | 1,823.9 | 1,942.8 | 2,855.9 | 5,353.7 | 9,021.4 | 15,201.9 | 25,616.6 | 43,166.2 |
| EBITDA, % | 10.31 | 9.03 | 8.9 | 6.16 | 7.54 | 8.39 | 8.39 | 8.39 | 8.39 | 8.39 |
| Depreciation | 105.1 | 167.7 | 254.4 | 430.0 | 603.4 | 1,051.7 | 1,772.2 | 2,986.3 | 5,032.2 | 8,479.8 |
| Depreciation, % | 2.4 | 1.64 | 1.24 | 1.36 | 1.59 | 1.65 | 1.65 | 1.65 | 1.65 | 1.65 |
| EBIT | 346.8 | 753.6 | 1,569.5 | 1,512.8 | 2,252.5 | 4,302.0 | 7,249.2 | 12,215.6 | 20,584.3 | 34,686.5 |
| EBIT, % | 7.91 | 7.39 | 7.66 | 4.8 | 5.95 | 6.74 | 6.74 | 6.74 | 6.74 | 6.74 |
| Total Cash | 1,068.4 | 697.1 | 1,245.3 | 1,141.1 | 3,471.5 | 6,390.9 | 10,769.2 | 18,147.0 | 30,579.3 | 51,528.9 |
| Total Cash, percent | .0 | .0 | .0 | .0 | .0 | .0 | .0 | .0 | .0 | .0 |
| Account Receivables | 1,408.1 | 2,781.3 | 4,098.0 | 9,625.2 | 14,774.6 | 19,007.6 | 32,029.5 | 53,972.7 | 90,948.8 | 153,256.9 |
| Account Receivables, % | 32.13 | 27.28 | 20.01 | 30.52 | 39.02 | 29.79 | 29.79 | 29.79 | 29.79 | 29.79 |
| Inventories | 1,788.8 | 2,913.0 | 5,874.4 | 10,042.6 | 8,218.7 | 19,346.8 | 32,601.1 | 54,935.8 | 92,571.8 | 155,991.8 |
| Inventories, % | 40.81 | 28.57 | 28.68 | 31.84 | 21.7 | 30.32 | 30.32 | 30.32 | 30.32 | 30.32 |
| Accounts Payable | 1,902.5 | 2,404.5 | 4,894.8 | 12,232.4 | 15,743.9 | 21,853.4 | 36,824.9 | 62,053.2 | 104,565.2 | 176,201.8 |
| Accounts Payable, % | 43.4 | 23.58 | 23.9 | 38.78 | 41.58 | 34.25 | 34.25 | 34.25 | 34.25 | 34.25 |
| Capital Expenditure | -193.8 | -904.8 | -1,184.0 | -3,376.8 | -2,365.4 | -4,597.8 | -7,747.7 | -13,055.5 | -21,999.7 | -37,071.5 |
| Capital Expenditure, % | -4.42 | -8.87 | -5.78 | -10.71 | -6.25 | -7.21 | -7.21 | -7.21 | -7.21 | -7.21 |
| Tax Rate, % | 28.35 | 28.35 | 28.35 | 28.35 | 28.35 | 28.35 | 28.35 | 28.35 | 28.35 | 28.35 |
| EBITAT | 279.4 | 501.6 | 1,048.0 | 975.5 | 1,614.0 | 3,011.7 | 5,075.1 | 8,551.9 | 14,410.8 | 24,283.5 |
| Depreciation | ||||||||||
| Changes in Account Receivables | ||||||||||
| Changes in Inventories | ||||||||||
| Changes in Accounts Payable | ||||||||||
| Capital Expenditure | ||||||||||
| UFCF | -1,103.7 | -2,230.9 | -1,669.4 | -4,328.9 | 37.9 | -9,786.0 | -12,205.1 | -20,566.7 | -34,656.8 | -58,399.8 |
| WACC, % | 4.78 | 4.73 | 4.73 | 4.72 | 4.75 | 4.74 | 4.74 | 4.74 | 4.74 | 4.74 |
| PV UFCF | ||||||||||
| SUM PV UFCF | -113,482.5 | |||||||||
| Long Term Growth Rate, % | 4.00 | |||||||||
| Free cash flow (T + 1) | -60,736 | |||||||||
| Terminal Value | -8,181,102 | |||||||||
| Present Terminal Value | -6,489,323 | |||||||||
| Enterprise Value | -6,602,806 | |||||||||
| Net Debt | 3,688 | |||||||||
| Equity Value | -6,606,494 | |||||||||
| Diluted Shares Outstanding, MM | 178 | |||||||||
| Equity Value Per Share | -37,026.03 |
What You Will Receive
- Authentic SYRMANS Financials: Access to historical and projected data for precise valuation.
- Customizable Parameters: Adjust WACC, tax rates, revenue growth, and capital expenditures as needed.
- Real-Time Calculations: Instant calculations of intrinsic value and NPV at your fingertips.
- Scenario Evaluation: Explore various scenarios to assess the future potential of Syrma SGS Technology Limited.
- User-Friendly Interface: Designed for professionals, yet easy enough for newcomers to navigate.
Key Features
- Comprehensive Data Access: Historical financial statements and detailed forecasts for Syrma SGS Technology Limited (SYRMANS).
- Customizable Parameters: Adjust WACC, tax rates, revenue growth, and EBITDA margins to fit your analysis.
- Real-Time Calculations: Observe the recalibration of Syrma's intrinsic value instantly.
- Intuitive Visualizations: Dashboard charts effectively present valuation outcomes and essential metrics.
- Designed for Precision: A robust tool tailored for analysts, investors, and finance professionals.
How It Works
- Step 1: Download the Excel file.
- Step 2: Examine the pre-filled Syrma SGS Technology Limited (SYRMANS) data (historical and projected).
- Step 3: Modify key assumptions (highlighted in yellow) based on your insights.
- Step 4: Observe automatic recalculations for Syrma SGS Technology Limited’s (SYRMANS) intrinsic value.
- Step 5: Utilize the results for making investment decisions or for reporting purposes.
Why Opt for This Calculator?
- Reliable Data: Accurate financials from Syrma SGS Technology Limited (SYRMANS) provide trustworthy valuation results.
- Tailored Experience: Modify essential parameters like growth rates, WACC, and tax rates to align with your forecasts.
- Efficient: Built-in calculations save you the hassle of starting from the ground up.
- Expert-Level Tool: Tailored for investors, analysts, and consultants alike.
- Easy to Use: A user-friendly interface and clear step-by-step guidance ensure accessibility for all users.
Who Can Benefit from This Product?
- Investors: Evaluate the fair value of Syrma SGS Technology Limited (SYRMANS) with precision before making investment choices.
- CFOs: Utilize a top-tier DCF model for accurate financial reporting and analysis.
- Consultants: Easily customize the template for client valuation reports.
- Entrepreneurs: Acquire valuable insights into financial modeling practices of leading companies.
- Educators: Employ it as a resource to illustrate valuation techniques in the classroom.
What the Template Contains
- Historical Data: Provides a comprehensive overview of Syrma SGS Technology Limited’s (SYRMANS) past financial performance and foundational forecasts.
- DCF and Levered DCF Models: In-depth templates designed to assess the intrinsic value of Syrma SGS Technology Limited (SYRMANS).
- WACC Sheet: Pre-calculated metrics for Weighted Average Cost of Capital.
- Editable Inputs: Customize essential drivers such as growth percentages, EBITDA margins, and capital expenditure assumptions.
- Quarterly and Annual Statements: An extensive analysis of Syrma SGS Technology Limited’s (SYRMANS) financial data.
- Interactive Dashboard: Engage with dynamic visualizations of valuation outcomes and forecasts.
Disclaimer
All information, articles, and product details provided on this website are for general informational and educational purposes only. We do not claim any ownership over, nor do we intend to infringe upon, any trademarks, copyrights, logos, brand names, or other intellectual property mentioned or depicted on this site. Such intellectual property remains the property of its respective owners, and any references here are made solely for identification or informational purposes, without implying any affiliation, endorsement, or partnership.
We make no representations or warranties, express or implied, regarding the accuracy, completeness, or suitability of any content or products presented. Nothing on this website should be construed as legal, tax, investment, financial, medical, or other professional advice. In addition, no part of this site—including articles or product references—constitutes a solicitation, recommendation, endorsement, advertisement, or offer to buy or sell any securities, franchises, or other financial instruments, particularly in jurisdictions where such activity would be unlawful.
All content is of a general nature and may not address the specific circumstances of any individual or entity. It is not a substitute for professional advice or services. Any actions you take based on the information provided here are strictly at your own risk. You accept full responsibility for any decisions or outcomes arising from your use of this website and agree to release us from any liability in connection with your use of, or reliance upon, the content or products found herein.