
|
تقييم شركة Transalta (TAC) DCF |
Fully Editable: Tailor To Your Needs In Excel Or Sheets
Professional Design: Trusted, Industry-Standard Templates
Investor-Approved Valuation Models
MAC/PC Compatible, Fully Unlocked
No Expertise Is Needed; Easy To Follow
TransAlta Corporation (TAC) Bundle
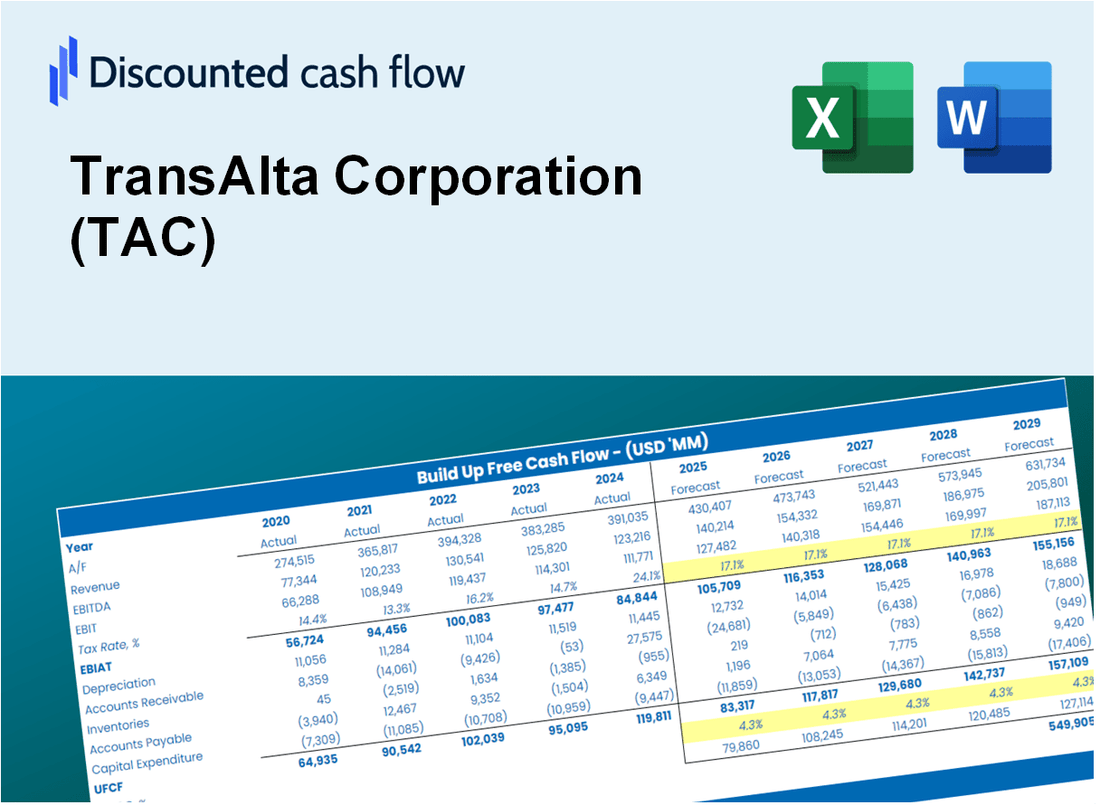
تم تصميم حاسبة DCF الخاصة بنا ، المصممة من أجل الدقة ، إلى تقييم تقييم شركة Transalta Corporation باستخدام البيانات المالية الفعلية ، مما يوفر مرونة شاملة لتعديل جميع المعلمات الرئيسية للتوقعات المحسنة.
What You Will Get
- Real TAC Financial Data: Pre-filled with TransAlta Corporation's historical and projected data for precise analysis.
- Fully Editable Template: Modify key inputs like revenue growth, WACC, and EBITDA % with ease.
- Automatic Calculations: See TransAlta Corporation’s intrinsic value update instantly based on your changes.
- Professional Valuation Tool: Designed for investors, analysts, and consultants seeking accurate DCF results.
- User-Friendly Design: Simple structure and clear instructions for all experience levels.
Key Features
- Accurate TransAlta Financials: Gain access to reliable pre-loaded historical data and future forecasts.
- Adjustable Forecast Parameters: Modify highlighted fields such as WACC, growth rates, and profit margins.
- Real-Time Calculations: Automatic updates for DCF, Net Present Value (NPV), and cash flow assessments.
- User-Friendly Dashboard: Clear charts and summaries to help visualize your valuation outcomes.
- Suitable for All Skill Levels: An intuitive design tailored for investors, CFOs, and consultants alike.
How It Works
- Step 1: Download the Excel file for TransAlta Corporation (TAC).
- Step 2: Review TransAlta’s pre-filled financial data and forecasts.
- Step 3: Modify key inputs such as revenue growth, WACC, and tax rates (highlighted cells).
- Step 4: Observe the DCF model update in real-time as you adjust your assumptions.
- Step 5: Analyze the outputs and leverage the results for your investment decisions.
Why Choose This Calculator for TransAlta Corporation (TAC)?
- Accurate Data: Utilize real TransAlta financials for dependable valuation outcomes.
- Customizable: Modify essential parameters such as growth rates, WACC, and tax rates to fit your forecasts.
- Time-Saving: Pre-built calculations mean you don't have to start from the ground up.
- Professional-Grade Tool: Tailored for investors, analysts, and consultants in the energy sector.
- User-Friendly: An intuitive interface and step-by-step guidance make it accessible for everyone.
Who Should Use This Product?
- Investors: Evaluate TransAlta Corporation's (TAC) market position before making investment decisions.
- CFOs and Financial Analysts: Enhance financial modeling and assess future earnings potential for TransAlta Corporation (TAC).
- Startup Founders: Understand the valuation methodologies applied to established companies like TransAlta Corporation (TAC).
- Consultants: Provide detailed valuation assessments and reports for clients interested in the energy sector.
- Students and Educators: Utilize current data from TransAlta Corporation (TAC) to teach and learn valuation strategies.
What the Template Contains
- Operating and Balance Sheet Data: Pre-filled TransAlta Corporation (TAC) historical data and forecasts, including revenue, EBITDA, EBIT, and capital expenditures.
- WACC Calculation: A dedicated sheet for Weighted Average Cost of Capital (WACC), including parameters like Beta, risk-free rate, and share price.
- DCF Valuation (Unlevered and Levered): Editable Discounted Cash Flow models showing intrinsic value with detailed calculations.
- Financial Statements: Pre-loaded financial statements (annual and quarterly) to support analysis.
- Key Ratios: Includes profitability, leverage, and efficiency ratios for TransAlta Corporation (TAC).
- Dashboard and Charts: Visual summary of valuation outputs and assumptions to analyze results easily.
Disclaimer
All information, articles, and product details provided on this website are for general informational and educational purposes only. We do not claim any ownership over, nor do we intend to infringe upon, any trademarks, copyrights, logos, brand names, or other intellectual property mentioned or depicted on this site. Such intellectual property remains the property of its respective owners, and any references here are made solely for identification or informational purposes, without implying any affiliation, endorsement, or partnership.
We make no representations or warranties, express or implied, regarding the accuracy, completeness, or suitability of any content or products presented. Nothing on this website should be construed as legal, tax, investment, financial, medical, or other professional advice. In addition, no part of this site—including articles or product references—constitutes a solicitation, recommendation, endorsement, advertisement, or offer to buy or sell any securities, franchises, or other financial instruments, particularly in jurisdictions where such activity would be unlawful.
All content is of a general nature and may not address the specific circumstances of any individual or entity. It is not a substitute for professional advice or services. Any actions you take based on the information provided here are strictly at your own risk. You accept full responsibility for any decisions or outcomes arising from your use of this website and agree to release us from any liability in connection with your use of, or reliance upon, the content or products found herein.