
|
تقييم Tantech Holdings Ltd (TANH) DCF |
Fully Editable: Tailor To Your Needs In Excel Or Sheets
Professional Design: Trusted, Industry-Standard Templates
Investor-Approved Valuation Models
MAC/PC Compatible, Fully Unlocked
No Expertise Is Needed; Easy To Follow
Tantech Holdings Ltd (TANH) Bundle
تبسيط تقييم Tantech Holdings Ltd (TANH) مع هذه الآلة الحاسبة DCF القابلة للتخصيص! يضم Dreal Tantech Holdings Ltd (TANH) والمدخلات المتوقعة القابلة للتعديل ، يمكنك اختبار السيناريوهات وكشف القيمة العادلة Tantech Holdings Ltd (TANH) في دقائق.
What You Will Get
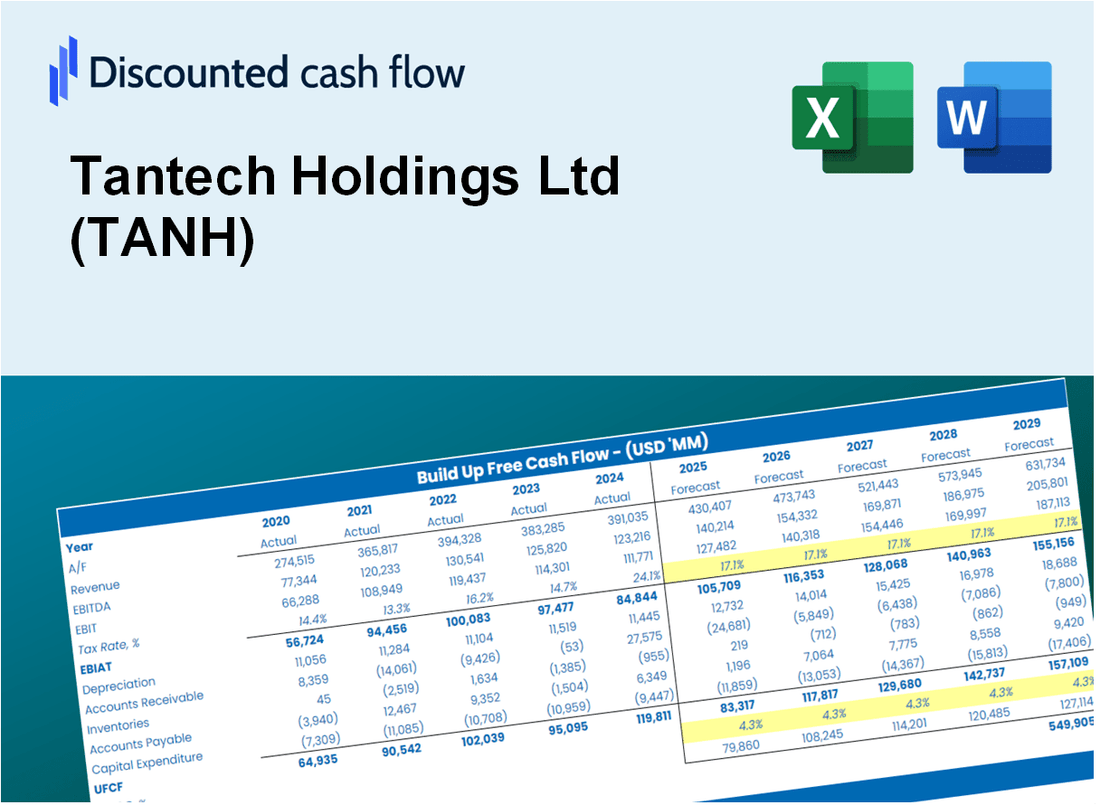
- Editable Excel Template: A fully customizable Excel-based DCF Calculator featuring pre-filled real TANH financials.
- Real-World Data: Historical data and forward-looking estimates (as indicated in the yellow cells).
- Forecast Flexibility: Adjust forecast assumptions such as revenue growth, EBITDA %, and WACC.
- Automatic Calculations: Instantly observe how your inputs affect Tantech Holdings Ltd's valuation.
- Professional Tool: Designed for investors, CFOs, consultants, and financial analysts.
- User-Friendly Design: Organized for clarity and ease of use, complete with step-by-step instructions.
Key Features
- Comprehensive Data Access: Tantech Holdings Ltd's (TANH) historical financial reports and pre-filled forecasts.
- Customizable Parameters: Modify WACC, tax rates, revenue growth, and EBITDA margins as needed.
- Real-Time Insights: Observe the recalculation of Tantech's (TANH) intrinsic value instantly.
- Intuitive Visual Displays: Dashboard graphs showcase valuation outcomes and essential metrics.
- Designed for Precision: A professional-grade tool for analysts, investors, and finance professionals.
How It Works
- 1. Access the Template: Download and open the Excel file featuring Tantech Holdings Ltd’s (TANH) preloaded financial data.
- 2. Modify Assumptions: Adjust key parameters such as growth rates, WACC, and capital expenditures specific to Tantech Holdings Ltd (TANH).
- 3. View Results Instantly: The DCF model automatically calculates the intrinsic value and NPV based on your inputs.
- 4. Explore Scenarios: Analyze various forecasts to understand different valuation scenarios for Tantech Holdings Ltd (TANH).
- 5. Present with Confidence: Deliver professional valuation insights to back your investment decisions regarding Tantech Holdings Ltd (TANH).
Why Choose This Calculator for Tantech Holdings Ltd (TANH)?
- All-in-One Solution: Features DCF, WACC, and financial ratio analyses tailored for Tantech Holdings Ltd (TANH).
- Flexible Inputs: Modify yellow-highlighted cells to explore different financial scenarios.
- In-Depth Analysis: Automatically computes Tantech Holdings Ltd (TANH)’s intrinsic value and Net Present Value.
- Preloaded Information: Access to historical and projected data for precise analysis.
- Expert-Level Tool: Perfect for financial analysts, investors, and business consultants focusing on Tantech Holdings Ltd (TANH).
Who Should Use This Product?
- Finance Students: Master valuation methods and apply them with real-world data specific to Tantech Holdings Ltd (TANH).
- Academics: Integrate advanced financial models into your studies or research involving Tantech Holdings Ltd (TANH).
- Investors: Evaluate your investment strategies and analyze the valuation metrics for Tantech Holdings Ltd (TANH).
- Analysts: Optimize your analysis process with a customizable DCF model tailored for Tantech Holdings Ltd (TANH).
- Small Business Owners: Understand the analytical approaches used for larger public companies like Tantech Holdings Ltd (TANH).
What the Template Contains
- Pre-Filled DCF Model: Tantech Holdings Ltd’s financial data preloaded for immediate use.
- WACC Calculator: Detailed calculations for Weighted Average Cost of Capital.
- Financial Ratios: Evaluate Tantech Holdings Ltd’s profitability, leverage, and efficiency.
- Editable Inputs: Change assumptions such as growth, margins, and CAPEX to fit your scenarios.
- Financial Statements: Annual and quarterly reports to support detailed analysis.
- Interactive Dashboard: Easily visualize key valuation metrics and results.
Disclaimer
All information, articles, and product details provided on this website are for general informational and educational purposes only. We do not claim any ownership over, nor do we intend to infringe upon, any trademarks, copyrights, logos, brand names, or other intellectual property mentioned or depicted on this site. Such intellectual property remains the property of its respective owners, and any references here are made solely for identification or informational purposes, without implying any affiliation, endorsement, or partnership.
We make no representations or warranties, express or implied, regarding the accuracy, completeness, or suitability of any content or products presented. Nothing on this website should be construed as legal, tax, investment, financial, medical, or other professional advice. In addition, no part of this site—including articles or product references—constitutes a solicitation, recommendation, endorsement, advertisement, or offer to buy or sell any securities, franchises, or other financial instruments, particularly in jurisdictions where such activity would be unlawful.
All content is of a general nature and may not address the specific circumstances of any individual or entity. It is not a substitute for professional advice or services. Any actions you take based on the information provided here are strictly at your own risk. You accept full responsibility for any decisions or outcomes arising from your use of this website and agree to release us from any liability in connection with your use of, or reliance upon, the content or products found herein.