
|
Teladoc Health ، Inc. (TDOC) تقييم DCF |
Fully Editable: Tailor To Your Needs In Excel Or Sheets
Professional Design: Trusted, Industry-Standard Templates
Investor-Approved Valuation Models
MAC/PC Compatible, Fully Unlocked
No Expertise Is Needed; Easy To Follow
Teladoc Health, Inc. (TDOC) Bundle
قم بتقييم Teladoc Health، Inc. ' (TDOC) الآفاق المالية مثل الخبير! تأتي حاسبة DCF (TDOC) هذه مع بيانات مالية مملوءة مسبقًا وتوفر مرونة كاملة لتعديل نمو الإيرادات و WACC والهوامش والافتراضات الحاسمة الأخرى لتتماشى مع توقعاتك.
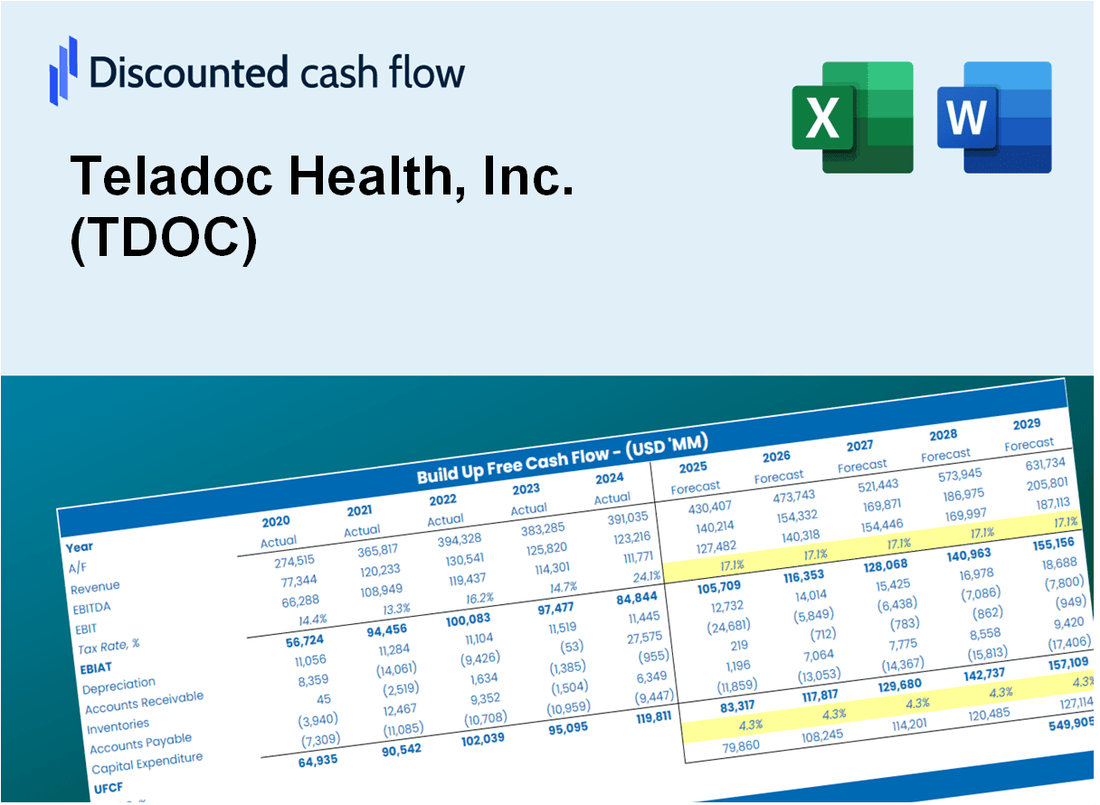
Discounted Cash Flow (DCF) - (USD MM)
| Year | AY1 2020 |
AY2 2021 |
AY3 2022 |
AY4 2023 |
AY5 2024 |
FY1 2025 |
FY2 2026 |
FY3 2027 |
FY4 2028 |
FY5 2029 |
|---|---|---|---|---|---|---|---|---|---|---|
| Revenue | 1,094.0 | 2,032.7 | 2,406.8 | 2,602.4 | 2,569.6 | 3,283.2 | 4,194.9 | 5,359.8 | 6,848.3 | 8,750.0 |
| Revenue Growth, % | 0 | 85.81 | 18.41 | 8.13 | -1.26 | 27.77 | 27.77 | 27.77 | 27.77 | 27.77 |
| EBITDA | -438.0 | -84.7 | -13,383.4 | 154.0 | -587.0 | -1,058.0 | -1,351.9 | -1,727.3 | -2,206.9 | -2,819.8 |
| EBITDA, % | -40.04 | -4.17 | -556.06 | 5.92 | -22.84 | -32.23 | -32.23 | -32.23 | -32.23 | -32.23 |
| Depreciation | 78.1 | 219.6 | 270.6 | 351.3 | 382.8 | 378.1 | 483.1 | 617.3 | 788.7 | 1,007.8 |
| Depreciation, % | 7.14 | 10.8 | 11.24 | 13.5 | 14.9 | 11.52 | 11.52 | 11.52 | 11.52 | 11.52 |
| EBIT | -516.1 | -304.3 | -13,654.1 | -197.3 | -969.9 | -1,362.3 | -1,740.7 | -2,224.0 | -2,841.7 | -3,630.8 |
| EBIT, % | -47.18 | -14.97 | -567.3 | -7.58 | -37.74 | -41.49 | -41.49 | -41.49 | -41.49 | -41.49 |
| Total Cash | 786.6 | 896.0 | 918.2 | 1,123.7 | 1,298.3 | 1,627.4 | 2,079.3 | 2,656.7 | 3,394.5 | 4,337.1 |
| Total Cash, percent | .0 | .0 | .0 | .0 | .0 | .0 | .0 | .0 | .0 | .0 |
| Account Receivables | 169.3 | 190.1 | 235.6 | 230.1 | 224.0 | 342.6 | 437.7 | 559.3 | 714.6 | 913.0 |
| Account Receivables, % | 15.47 | 9.35 | 9.79 | 8.84 | 8.72 | 10.43 | 10.43 | 10.43 | 10.43 | 10.43 |
| Inventories | 56.5 | 73.1 | 56.3 | 29.5 | 38.1 | 90.1 | 115.1 | 147.1 | 187.9 | 240.1 |
| Inventories, % | 5.16 | 3.6 | 2.34 | 1.13 | 1.48 | 2.74 | 2.74 | 2.74 | 2.74 | 2.74 |
| Accounts Payable | 46.0 | 47.3 | 47.7 | 43.6 | 33.1 | 75.4 | 96.3 | 123.1 | 157.2 | 200.9 |
| Accounts Payable, % | 4.21 | 2.32 | 1.98 | 1.68 | 1.29 | 2.3 | 2.3 | 2.3 | 2.3 | 2.3 |
| Capital Expenditure | -26.0 | -63.9 | -172.8 | -156.3 | -10.8 | -125.6 | -160.5 | -205.1 | -262.0 | -334.8 |
| Capital Expenditure, % | -2.38 | -3.15 | -7.18 | -6.01 | -0.41991 | -3.83 | -3.83 | -3.83 | -3.83 | -3.83 |
| Tax Rate, % | -0.76405 | -0.76405 | -0.76405 | -0.76405 | -0.76405 | -0.76405 | -0.76405 | -0.76405 | -0.76405 | -0.76405 |
| EBITAT | -434.7 | -339.2 | -13,650.3 | -198.0 | -977.3 | -1,319.3 | -1,685.6 | -2,153.7 | -2,751.8 | -3,516.0 |
| Depreciation | ||||||||||
| Changes in Account Receivables | ||||||||||
| Changes in Inventories | ||||||||||
| Changes in Accounts Payable | ||||||||||
| Capital Expenditure | ||||||||||
| UFCF | -562.4 | -219.7 | -13,580.7 | 25.3 | -618.2 | -1,195.1 | -1,462.2 | -1,868.3 | -2,387.1 | -3,050.0 |
| WACC, % | 7.61 | 7.91 | 7.9 | 7.91 | 7.91 | 7.85 | 7.85 | 7.85 | 7.85 | 7.85 |
| PV UFCF | ||||||||||
| SUM PV UFCF | -7,710.2 | |||||||||
| Long Term Growth Rate, % | 2.00 | |||||||||
| Free cash flow (T + 1) | -3,111 | |||||||||
| Terminal Value | -53,216 | |||||||||
| Present Terminal Value | -36,477 | |||||||||
| Enterprise Value | -44,187 | |||||||||
| Net Debt | 286 | |||||||||
| Equity Value | -44,473 | |||||||||
| Diluted Shares Outstanding, MM | 171 | |||||||||
| Equity Value Per Share | -260.74 |
What You Will Get
- Comprehensive TDOC Financials: Access to historical and projected data for precise valuation.
- Customizable Inputs: Adjust WACC, tax rates, revenue growth, and capital expenditures as needed.
- Real-Time Calculations: Intrinsic value and NPV are computed automatically.
- Scenario Analysis: Evaluate various scenarios to assess Teladoc's future performance.
- User-Friendly Interface: Designed for professionals while remaining approachable for newcomers.
Key Features
- Comprehensive Data: Teladoc Health’s historical financial statements and pre-filled projections.
- Customizable Parameters: Adjust WACC, tax rates, revenue growth, and EBITDA margins as needed.
- Real-Time Analysis: Monitor Teladoc Health’s intrinsic value recalculating instantly.
- Intuitive Visualizations: Dashboard charts present valuation outcomes and essential metrics.
- Designed for Precision: A professional-grade tool for analysts, investors, and finance professionals.
How It Works
- 1. Access the Template: Download and open the Excel file featuring Teladoc Health, Inc.'s (TDOC) preloaded data.
- 2. Modify Assumptions: Adjust key variables such as growth rates, WACC, and capital expenditures.
- 3. View Results Instantly: The DCF model automatically computes intrinsic value and NPV.
- 4. Explore Scenarios: Evaluate various forecasts to assess different valuation results.
- 5. Present with Confidence: Deliver expert valuation insights to enhance your decision-making.
Why Choose Teladoc Health, Inc. (TDOC)?
- Convenient Access: Get healthcare services anytime, anywhere with just a few clicks.
- Enhanced Care Quality: Access to a network of licensed professionals ensures high-quality medical advice.
- Personalized Health Solutions: Tailor your healthcare experience to meet your individual needs and preferences.
- User-Friendly Platform: Intuitive design makes it easy to navigate and utilize our services effectively.
- Proven Track Record: Trusted by millions for delivering reliable and efficient telehealth solutions.
Who Should Use This Product?
- Healthcare Professionals: Understand telehealth trends and improve patient engagement using real-time data.
- Researchers: Utilize advanced models to analyze the impact of telemedicine on healthcare delivery.
- Investors: Evaluate your investment strategies and assess valuation metrics for Teladoc Health, Inc. (TDOC).
- Market Analysts: Enhance your analysis with a customizable financial model tailored for the telehealth sector.
- Health Tech Entrepreneurs: Learn from the valuation approaches used by leading telehealth companies like Teladoc.
What the Template Contains
- Preloaded TDOC Data: Historical and projected financial data, including revenue, EBIT, and capital expenditures.
- DCF and WACC Models: Professional-grade sheets for calculating intrinsic value and Weighted Average Cost of Capital.
- Editable Inputs: Yellow-highlighted cells for adjusting revenue growth, tax rates, and discount rates.
- Financial Statements: Comprehensive annual and quarterly financials for deeper analysis.
- Key Ratios: Profitability, leverage, and efficiency ratios to evaluate performance.
- Dashboard and Charts: Visual summaries of valuation outcomes and assumptions.
Disclaimer
All information, articles, and product details provided on this website are for general informational and educational purposes only. We do not claim any ownership over, nor do we intend to infringe upon, any trademarks, copyrights, logos, brand names, or other intellectual property mentioned or depicted on this site. Such intellectual property remains the property of its respective owners, and any references here are made solely for identification or informational purposes, without implying any affiliation, endorsement, or partnership.
We make no representations or warranties, express or implied, regarding the accuracy, completeness, or suitability of any content or products presented. Nothing on this website should be construed as legal, tax, investment, financial, medical, or other professional advice. In addition, no part of this site—including articles or product references—constitutes a solicitation, recommendation, endorsement, advertisement, or offer to buy or sell any securities, franchises, or other financial instruments, particularly in jurisdictions where such activity would be unlawful.
All content is of a general nature and may not address the specific circumstances of any individual or entity. It is not a substitute for professional advice or services. Any actions you take based on the information provided here are strictly at your own risk. You accept full responsibility for any decisions or outcomes arising from your use of this website and agree to release us from any liability in connection with your use of, or reliance upon, the content or products found herein.