
|
Terns Pharmaceuticals ، Inc. (Tern) DCF تقييم |
Fully Editable: Tailor To Your Needs In Excel Or Sheets
Professional Design: Trusted, Industry-Standard Templates
Investor-Approved Valuation Models
MAC/PC Compatible, Fully Unlocked
No Expertise Is Needed; Easy To Follow
Terns Pharmaceuticals, Inc. (TERN) Bundle
تبسيط تحليلك وتحسين الدقة مع حاسبة (Tern) DCF لدينا! باستخدام بيانات حديثة من Terns Pharmaceuticals ، Inc. والافتراضات القابلة للتخصيص ، تمكنك هذه الأداة من التنبؤ وتقييم وتقييم قيمة (Tern) مثل المستثمر الخبير.
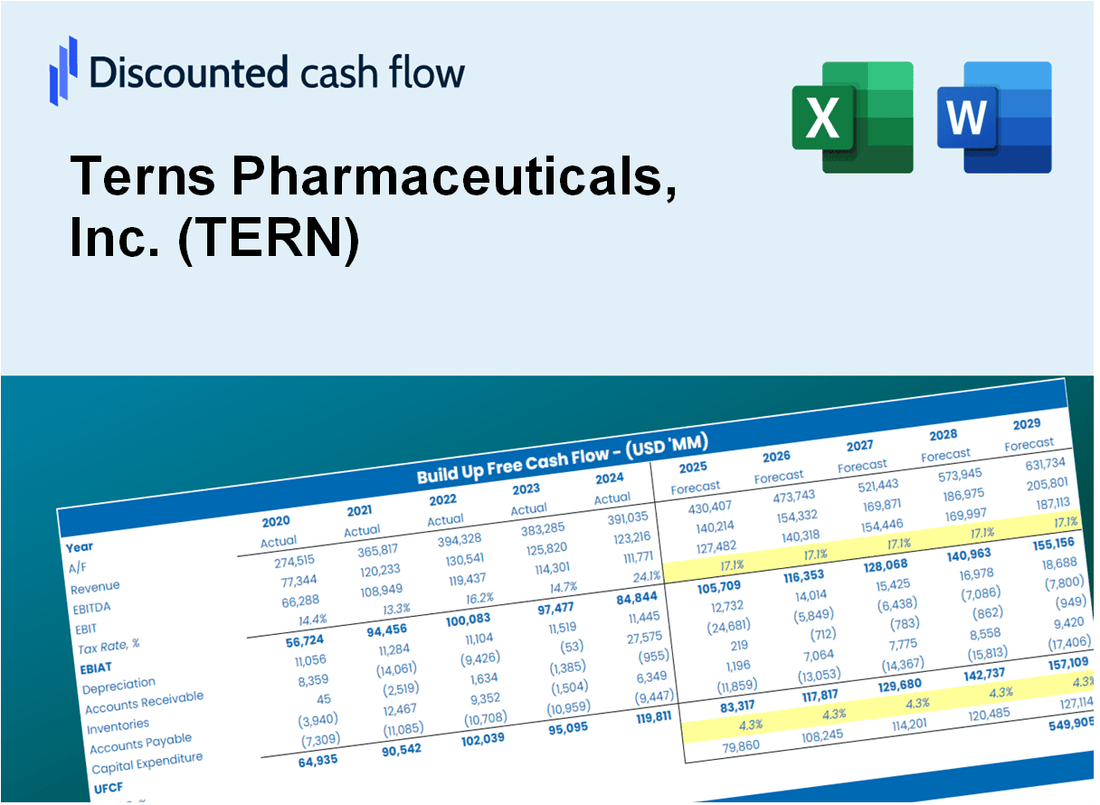
Discounted Cash Flow (DCF) - (USD MM)
| Year | AY1 2020 |
AY2 2021 |
AY3 2022 |
AY4 2023 |
AY5 2024 |
FY1 2025 |
FY2 2026 |
FY3 2027 |
FY4 2028 |
FY5 2029 |
|---|---|---|---|---|---|---|---|---|---|---|
| Revenue | .0 | 1.0 | .0 | .0 | .0 | .0 | .0 | .0 | .0 | .0 |
| Revenue Growth, % | 0 | 0 | -100 | 0 | 0 | -25 | -25 | -25 | -25 | -25 |
| EBITDA | -36.6 | -49.3 | -59.0 | -102.3 | -87.7 | .0 | .0 | .0 | .0 | .0 |
| EBITDA, % | 100 | -4934.8 | 100 | 100 | 100 | 60 | 60 | 60 | 60 | 60 |
| Depreciation | .4 | .5 | 1.0 | .3 | .9 | .0 | .0 | .0 | .0 | .0 |
| Depreciation, % | 100 | 51.2 | 100 | 100 | 100 | 90.24 | 90.24 | 90.24 | 90.24 | 90.24 |
| EBIT | -37.0 | -49.9 | -60.0 | -102.6 | -88.6 | .0 | .0 | .0 | .0 | .0 |
| EBIT, % | 100 | -4986 | 100 | 100 | 100 | 60 | 60 | 60 | 60 | 60 |
| Total Cash | 74.9 | 166.0 | 283.1 | 263.4 | 358.2 | .0 | .0 | .0 | .0 | .0 |
| Total Cash, percent | .0 | .0 | .0 | .0 | .0 | .0 | .0 | .0 | .0 | .0 |
| Account Receivables | 12.7 | .0 | .0 | .0 | .0 | .0 | .0 | .0 | .0 | .0 |
| Account Receivables, % | 100 | 0 | 100 | 100 | 100 | 80 | 80 | 80 | 80 | 80 |
| Inventories | 3.0 | .0 | .0 | .0 | .0 | .0 | .0 | .0 | .0 | .0 |
| Inventories, % | 100 | 0 | 100 | 100 | 100 | 80 | 80 | 80 | 80 | 80 |
| Accounts Payable | .9 | 2.1 | 1.6 | 2.5 | 2.1 | .0 | .0 | .0 | .0 | .0 |
| Accounts Payable, % | 100 | 212.6 | 100 | 100 | 100 | 100 | 100 | 100 | 100 | 100 |
| Capital Expenditure | -.6 | -.3 | -.3 | -.1 | .0 | .0 | .0 | .0 | .0 | .0 |
| Capital Expenditure, % | 100 | -34 | 100 | 100 | 100 | -6.8 | -6.8 | -6.8 | -6.8 | -6.8 |
| Tax Rate, % | -0.29348 | -0.29348 | -0.29348 | -0.29348 | -0.29348 | -0.29348 | -0.29348 | -0.29348 | -0.29348 | -0.29348 |
| EBITAT | -37.8 | -50.4 | -60.3 | -102.8 | -88.9 | .0 | .0 | .0 | .0 | .0 |
| Depreciation | ||||||||||
| Changes in Account Receivables | ||||||||||
| Changes in Inventories | ||||||||||
| Changes in Accounts Payable | ||||||||||
| Capital Expenditure | ||||||||||
| UFCF | -52.7 | -33.3 | -60.1 | -101.7 | -88.4 | -2.1 | .0 | .0 | .0 | .0 |
| WACC, % | 4.65 | 4.65 | 4.65 | 4.65 | 4.65 | 4.65 | 4.65 | 4.65 | 4.65 | 4.65 |
| PV UFCF | ||||||||||
| SUM PV UFCF | -2.1 | |||||||||
| Long Term Growth Rate, % | 2.00 | |||||||||
| Free cash flow (T + 1) | 0 | |||||||||
| Terminal Value | 0 | |||||||||
| Present Terminal Value | 0 | |||||||||
| Enterprise Value | -2 | |||||||||
| Net Debt | -160 | |||||||||
| Equity Value | 158 | |||||||||
| Diluted Shares Outstanding, MM | 80 | |||||||||
| Equity Value Per Share | 1.99 |
What You Will Get
- Editable Excel Template: A fully customizable Excel-based DCF Calculator featuring pre-filled real TERN financials.
- Real-World Data: Access to historical data and forward-looking estimates (highlighted in the yellow cells).
- Forecast Flexibility: Adjust forecast assumptions such as revenue growth, EBITDA %, and WACC.
- Automatic Calculations: Instantly observe how your inputs affect Terns Pharmaceuticals’ valuation.
- Professional Tool: Designed for investors, CFOs, consultants, and financial analysts.
- User-Friendly Design: Organized for clarity and ease of use, complete with step-by-step instructions.
Key Features
- Comprehensive Terns Financials: Gain access to precise pre-loaded historical data and future forecasts.
- Adjustable Forecast Parameters: Modify editable cells highlighted in yellow, such as WACC, growth rates, and profit margins.
- Automated Calculations: Instant updates to DCF, Net Present Value (NPV), and cash flow assessments.
- Interactive Dashboard: User-friendly charts and summaries to help visualize your valuation outcomes.
- Designed for All Skill Levels: An easy-to-navigate layout tailored for investors, CFOs, and consultants alike.
How It Works
- Download: Access the ready-to-use Excel file with Terns Pharmaceuticals, Inc. (TERN) financial data.
- Customize: Adjust forecasts, including revenue growth, EBITDA %, and WACC.
- Update Automatically: The intrinsic value and NPV calculations update in real-time.
- Test Scenarios: Create multiple projections and compare outcomes instantly.
- Make Decisions: Use the valuation results to guide your investment strategy.
Why Choose Terns Pharmaceuticals, Inc. (TERN)?
- Innovative Solutions: Cutting-edge therapies developed to address unmet medical needs.
- Proven Expertise: A team of seasoned professionals with extensive industry experience.
- Commitment to Quality: Rigorous standards ensure the highest level of product integrity.
- Patient-Centric Approach: Focused on improving patient outcomes and quality of life.
- Strong Partnerships: Collaborations with leading organizations to enhance research and development.
Who Should Use This Product?
- Individual Investors: Make informed decisions about buying or selling Terns Pharmaceuticals stock (TERN).
- Financial Analysts: Streamline valuation processes with ready-to-use financial models specific to Terns Pharmaceuticals (TERN).
- Consultants: Deliver professional valuation insights to clients quickly and accurately, focusing on Terns Pharmaceuticals (TERN).
- Business Owners: Understand how biopharmaceutical companies like Terns Pharmaceuticals are valued to guide your own strategy (TERN).
- Finance Students: Learn valuation techniques using real-world data and scenarios related to Terns Pharmaceuticals (TERN).
What the Template Contains
- Historical Data: Includes Terns Pharmaceuticals’ past financials and baseline forecasts.
- DCF and Levered DCF Models: Detailed templates to calculate Terns Pharmaceuticals’ intrinsic value.
- WACC Sheet: Pre-built calculations for Weighted Average Cost of Capital.
- Editable Inputs: Modify key drivers like growth rates, EBITDA %, and CAPEX assumptions.
- Quarterly and Annual Statements: A complete breakdown of Terns Pharmaceuticals’ financials.
- Interactive Dashboard: Visualize valuation results and projections dynamically.
Disclaimer
All information, articles, and product details provided on this website are for general informational and educational purposes only. We do not claim any ownership over, nor do we intend to infringe upon, any trademarks, copyrights, logos, brand names, or other intellectual property mentioned or depicted on this site. Such intellectual property remains the property of its respective owners, and any references here are made solely for identification or informational purposes, without implying any affiliation, endorsement, or partnership.
We make no representations or warranties, express or implied, regarding the accuracy, completeness, or suitability of any content or products presented. Nothing on this website should be construed as legal, tax, investment, financial, medical, or other professional advice. In addition, no part of this site—including articles or product references—constitutes a solicitation, recommendation, endorsement, advertisement, or offer to buy or sell any securities, franchises, or other financial instruments, particularly in jurisdictions where such activity would be unlawful.
All content is of a general nature and may not address the specific circumstances of any individual or entity. It is not a substitute for professional advice or services. Any actions you take based on the information provided here are strictly at your own risk. You accept full responsibility for any decisions or outcomes arising from your use of this website and agree to release us from any liability in connection with your use of, or reliance upon, the content or products found herein.