
|
Tapestry ، Inc. (TPR) تقييم DCF |
Fully Editable: Tailor To Your Needs In Excel Or Sheets
Professional Design: Trusted, Industry-Standard Templates
Investor-Approved Valuation Models
MAC/PC Compatible, Fully Unlocked
No Expertise Is Needed; Easy To Follow
Tapestry, Inc. (TPR) Bundle
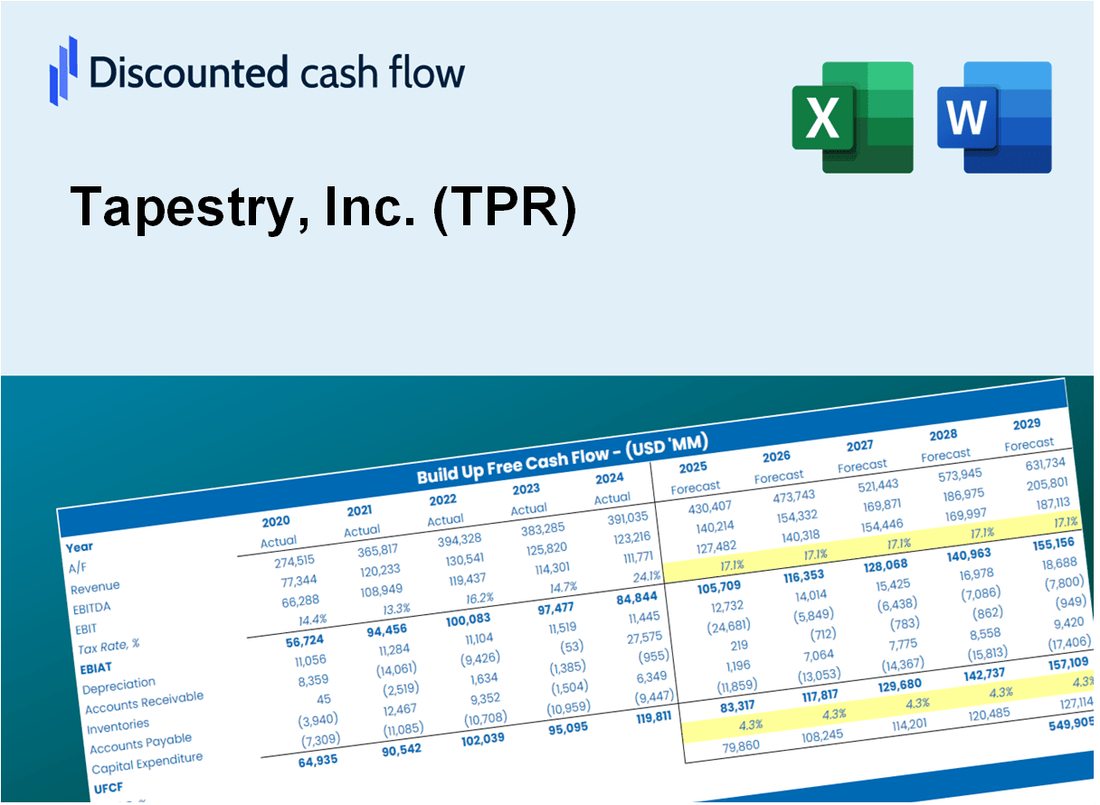
احصل على نظرة ثاقبة على تحليل تقييم Tapestry ، Inc. (TPR) مع حاسبة DCF المتطورة! يتم تحميله مسبقًا ببيانات TPR الحقيقية ، يتيح لك هذا القالب Excel ضبط التوقعات والافتراضات لتحديد القيمة الجوهرية لشركة Tapestry ، Inc.
Discounted Cash Flow (DCF) - (USD MM)
| Year | AY1 2021 |
AY2 2022 |
AY3 2023 |
AY4 2024 |
AY5 2025 |
FY1 2026 |
FY2 2027 |
FY3 2028 |
FY4 2029 |
FY5 2030 |
|---|---|---|---|---|---|---|---|---|---|---|
| Revenue | 5,746.3 | 6,684.5 | 6,660.9 | 6,671.2 | 7,010.7 | 7,382.6 | 7,774.2 | 8,186.6 | 8,620.8 | 9,078.1 |
| Revenue Growth, % | 0 | 16.33 | -0.35306 | 0.15463 | 5.09 | 5.3 | 5.3 | 5.3 | 5.3 | 5.3 |
| EBITDA | 1,187.4 | 1,301.0 | 1,394.9 | 1,365.9 | 526.4 | 1,314.9 | 1,384.6 | 1,458.0 | 1,535.4 | 1,616.8 |
| EBITDA, % | 20.66 | 19.46 | 20.94 | 20.47 | 7.51 | 17.81 | 17.81 | 17.81 | 17.81 | 17.81 |
| Depreciation | 218.7 | 195.3 | 224.2 | 229.0 | 224.9 | 247.1 | 260.2 | 274.0 | 288.5 | 303.8 |
| Depreciation, % | 3.81 | 2.92 | 3.37 | 3.43 | 3.21 | 3.35 | 3.35 | 3.35 | 3.35 | 3.35 |
| EBIT | 968.7 | 1,105.7 | 1,170.7 | 1,136.9 | 301.5 | 1,067.8 | 1,124.4 | 1,184.1 | 1,246.9 | 1,313.0 |
| EBIT, % | 16.86 | 16.54 | 17.58 | 17.04 | 4.3 | 14.46 | 14.46 | 14.46 | 14.46 | 14.46 |
| Total Cash | 2,015.8 | 953.2 | 741.5 | 7,203.8 | 1,119.6 | 2,605.2 | 2,743.4 | 2,888.9 | 3,042.1 | 3,203.5 |
| Total Cash, percent | .0 | .0 | .0 | .0 | .0 | .0 | .0 | .0 | .0 | .0 |
| Account Receivables | 454.8 | 469.5 | 442.6 | 464.4 | 516.6 | 530.3 | 558.4 | 588.0 | 619.2 | 652.0 |
| Account Receivables, % | 7.91 | 7.02 | 6.64 | 6.96 | 7.37 | 7.18 | 7.18 | 7.18 | 7.18 | 7.18 |
| Inventories | 734.8 | 994.2 | 919.5 | 824.8 | 860.7 | 976.1 | 1,027.8 | 1,082.4 | 1,139.8 | 1,200.2 |
| Inventories, % | 12.79 | 14.87 | 13.8 | 12.36 | 12.28 | 13.22 | 13.22 | 13.22 | 13.22 | 13.22 |
| Accounts Payable | 445.2 | 520.7 | 416.9 | 452.2 | 456.1 | 518.0 | 545.4 | 574.4 | 604.8 | 636.9 |
| Accounts Payable, % | 7.75 | 7.79 | 6.26 | 6.78 | 6.51 | 7.02 | 7.02 | 7.02 | 7.02 | 7.02 |
| Capital Expenditure | -116.0 | -93.9 | -184.2 | -108.9 | -122.7 | -141.3 | -148.8 | -156.7 | -165.0 | -173.8 |
| Capital Expenditure, % | -2.02 | -1.4 | -2.77 | -1.63 | -1.75 | -1.91 | -1.91 | -1.91 | -1.91 | -1.91 |
| Tax Rate, % | 15.22 | 15.22 | 15.22 | 15.22 | 15.22 | 15.22 | 15.22 | 15.22 | 15.22 | 15.22 |
| EBITAT | 900.6 | 904.3 | 958.6 | 916.8 | 255.6 | 901.3 | 949.1 | 999.5 | 1,052.5 | 1,108.3 |
| Depreciation | ||||||||||
| Changes in Account Receivables | ||||||||||
| Changes in Inventories | ||||||||||
| Changes in Accounts Payable | ||||||||||
| Capital Expenditure | ||||||||||
| UFCF | 258.9 | 807.1 | 996.4 | 1,145.1 | 273.6 | 939.9 | 1,008.1 | 1,061.5 | 1,117.8 | 1,177.1 |
| WACC, % | 10.13 | 10.07 | 10.07 | 10.06 | 10.08 | 10.08 | 10.08 | 10.08 | 10.08 | 10.08 |
| PV UFCF | ||||||||||
| SUM PV UFCF | 3,970.9 | |||||||||
| Long Term Growth Rate, % | 1.00 | |||||||||
| Free cash flow (T + 1) | 1,189 | |||||||||
| Terminal Value | 13,091 | |||||||||
| Present Terminal Value | 8,098 | |||||||||
| Enterprise Value | 12,069 | |||||||||
| Net Debt | 2,799 | |||||||||
| Equity Value | 9,270 | |||||||||
| Diluted Shares Outstanding, MM | 223 | |||||||||
| Equity Value Per Share | 41.66 |
What You Will Get
- Editable Forecast Inputs: Easily adjust assumptions (growth %, margins, WACC) to explore various scenarios.
- Real-World Data: Tapestry, Inc.'s (TPR) financial data pre-loaded to kickstart your analysis.
- Automatic DCF Outputs: The template computes Net Present Value (NPV) and intrinsic value automatically.
- Customizable and Professional: A sleek Excel model that tailors to your valuation requirements.
- Built for Analysts and Investors: Perfect for evaluating projections, confirming strategies, and enhancing efficiency.
Key Features
- Pre-Loaded Data: Tapestry, Inc.'s historical financial statements and pre-filled forecasts.
- Fully Adjustable Inputs: Modify WACC, tax rates, revenue growth, and EBITDA margins as needed.
- Instant Results: Observe Tapestry, Inc.'s intrinsic value recalculating in real time.
- Clear Visual Outputs: Dashboard charts illustrate valuation results and key metrics effectively.
- Built for Accuracy: A professional tool tailored for analysts, investors, and finance experts.
How It Works
- Step 1: Download the prebuilt Excel template containing Tapestry, Inc.'s (TPR) data.
- Step 2: Navigate through the pre-filled sheets to familiarize yourself with the key metrics.
- Step 3: Modify forecasts and assumptions in the editable yellow cells (WACC, growth, margins).
- Step 4: Instantly see the recalculated results, including Tapestry, Inc.'s (TPR) intrinsic value.
- Step 5: Make well-informed investment decisions or create reports based on the outputs.
Why Choose Tapestry, Inc. (TPR)?
- Enhance Efficiency: Skip the hassle of complex calculations – our tools are user-friendly and ready to go.
- Boost Precision: Access to verified financial insights minimizes valuation discrepancies.
- Completely Adaptable: Modify the tools to suit your unique assumptions and forecasts.
- Simple to Understand: Intuitive visuals and outputs facilitate straightforward analysis of results.
- Endorsed by Professionals: Crafted for industry experts who prioritize accuracy and functionality.
Who Should Use This Product?
- Individual Investors: Make informed decisions about buying or selling Tapestry, Inc. (TPR) stock.
- Financial Analysts: Streamline valuation processes with ready-to-use financial models for Tapestry, Inc. (TPR).
- Consultants: Deliver professional valuation insights on Tapestry, Inc. (TPR) to clients quickly and accurately.
- Business Owners: Understand how large companies like Tapestry, Inc. (TPR) are valued to guide your own strategy.
- Finance Students: Learn valuation techniques using real-world data and scenarios related to Tapestry, Inc. (TPR).
What the Template Contains
- Historical Data: Includes Tapestry, Inc.'s (TPR) past financials and baseline forecasts.
- DCF and Levered DCF Models: Detailed templates to calculate Tapestry, Inc.'s (TPR) intrinsic value.
- WACC Sheet: Pre-built calculations for Weighted Average Cost of Capital.
- Editable Inputs: Modify key drivers like growth rates, EBITDA %, and CAPEX assumptions.
- Quarterly and Annual Statements: A complete breakdown of Tapestry, Inc.'s (TPR) financials.
- Interactive Dashboard: Visualize valuation results and projections dynamically.
Disclaimer
All information, articles, and product details provided on this website are for general informational and educational purposes only. We do not claim any ownership over, nor do we intend to infringe upon, any trademarks, copyrights, logos, brand names, or other intellectual property mentioned or depicted on this site. Such intellectual property remains the property of its respective owners, and any references here are made solely for identification or informational purposes, without implying any affiliation, endorsement, or partnership.
We make no representations or warranties, express or implied, regarding the accuracy, completeness, or suitability of any content or products presented. Nothing on this website should be construed as legal, tax, investment, financial, medical, or other professional advice. In addition, no part of this site—including articles or product references—constitutes a solicitation, recommendation, endorsement, advertisement, or offer to buy or sell any securities, franchises, or other financial instruments, particularly in jurisdictions where such activity would be unlawful.
All content is of a general nature and may not address the specific circumstances of any individual or entity. It is not a substitute for professional advice or services. Any actions you take based on the information provided here are strictly at your own risk. You accept full responsibility for any decisions or outcomes arising from your use of this website and agree to release us from any liability in connection with your use of, or reliance upon, the content or products found herein.