
|
Timberland Bancorp ، Inc. (TSBK) DCF تقييم |
Fully Editable: Tailor To Your Needs In Excel Or Sheets
Professional Design: Trusted, Industry-Standard Templates
Investor-Approved Valuation Models
MAC/PC Compatible, Fully Unlocked
No Expertise Is Needed; Easy To Follow
Timberland Bancorp, Inc. (TSBK) Bundle
استكشف المستقبل المالي لـ Timberland Bancorp ، Inc. (TSBK) مع حاسبة DCF سهلة الاستخدام! أدخل توقعاتك للنمو والهوامش والمصروفات لحساب القيمة الجوهرية لـ Timberland Bancorp ، Inc. (TSBK) وتعزيز استراتيجية الاستثمار الخاصة بك.
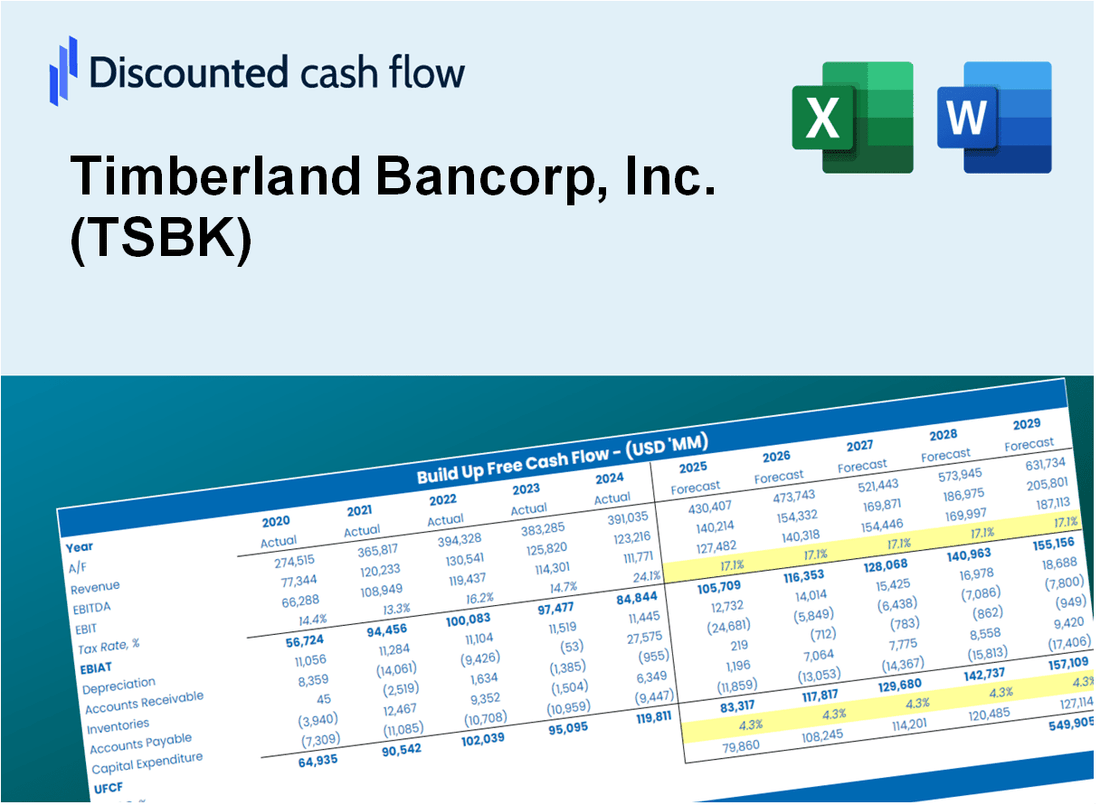
Discounted Cash Flow (DCF) - (USD MM)
| Year | AY1 2020 |
AY2 2021 |
AY3 2022 |
AY4 2023 |
AY5 2024 |
FY1 2025 |
FY2 2026 |
FY3 2027 |
FY4 2028 |
FY5 2029 |
|---|---|---|---|---|---|---|---|---|---|---|
| Revenue | 69.8 | 68.6 | 67.3 | 87.2 | 101.5 | 112.3 | 124.2 | 137.4 | 151.9 | 168.1 |
| Revenue Growth, % | 0 | -1.69 | -1.88 | 29.57 | 16.41 | 10.6 | 10.6 | 10.6 | 10.6 | 10.6 |
| EBITDA | 33.1 | 37.5 | 32.4 | 36.7 | 33.0 | 50.5 | 55.8 | 61.7 | 68.3 | 75.5 |
| EBITDA, % | 47.45 | 54.59 | 48.12 | 42.02 | 32.48 | 44.94 | 44.94 | 44.94 | 44.94 | 44.94 |
| Depreciation | 2.8 | 3.0 | 2.8 | 2.7 | 2.6 | 4.1 | 4.5 | 5.0 | 5.6 | 6.1 |
| Depreciation, % | 4.03 | 4.42 | 4.22 | 3.05 | 2.54 | 3.65 | 3.65 | 3.65 | 3.65 | 3.65 |
| EBIT | 30.3 | 34.4 | 29.6 | 34.0 | 30.4 | 46.4 | 51.3 | 56.7 | 62.7 | 69.4 |
| EBIT, % | 43.42 | 50.17 | 43.91 | 38.97 | 29.94 | 41.28 | 41.28 | 41.28 | 41.28 | 41.28 |
| Total Cash | 437.9 | 671.9 | 381.1 | 185.7 | 247.2 | 112.3 | 124.2 | 137.4 | 151.9 | 168.1 |
| Total Cash, percent | .0 | .0 | .0 | .0 | .0 | .0 | .0 | .0 | .0 | .0 |
| Account Receivables | 4.5 | 3.7 | 4.5 | 6.0 | 7.0 | 7.3 | 8.0 | 8.9 | 9.8 | 10.9 |
| Account Receivables, % | 6.42 | 5.46 | 6.66 | 6.88 | 6.88 | 6.46 | 6.46 | 6.46 | 6.46 | 6.46 |
| Inventories | .0 | .0 | .0 | .0 | .0 | .0 | .0 | .0 | .0 | .0 |
| Inventories, % | 0 | 0 | 0 | 0 | 0 | 0 | 0 | 0 | 0 | 0 |
| Accounts Payable | 4.2 | 4.3 | 4.9 | 6.4 | 6.3 | 7.4 | 8.2 | 9.1 | 10.1 | 11.1 |
| Accounts Payable, % | 6.02 | 6.26 | 7.29 | 7.32 | 6.24 | 6.63 | 6.63 | 6.63 | 6.63 | 6.63 |
| Capital Expenditure | -2.0 | -.9 | -.9 | -1.1 | -1.3 | -1.8 | -2.0 | -2.2 | -2.4 | -2.7 |
| Capital Expenditure, % | -2.85 | -1.3 | -1.35 | -1.27 | -1.29 | -1.61 | -1.61 | -1.61 | -1.61 | -1.61 |
| Tax Rate, % | 20.14 | 20.14 | 20.14 | 20.14 | 20.14 | 20.14 | 20.14 | 20.14 | 20.14 | 20.14 |
| EBITAT | 24.3 | 27.6 | 23.6 | 27.1 | 24.3 | 37.1 | 41.0 | 45.3 | 50.1 | 55.5 |
| Depreciation | ||||||||||
| Changes in Account Receivables | ||||||||||
| Changes in Inventories | ||||||||||
| Changes in Accounts Payable | ||||||||||
| Capital Expenditure | ||||||||||
| UFCF | 24.8 | 30.6 | 25.4 | 28.6 | 24.5 | 40.2 | 43.5 | 48.2 | 53.3 | 58.9 |
| WACC, % | 13.37 | 13.37 | 13.34 | 13.34 | 13.35 | 13.35 | 13.35 | 13.35 | 13.35 | 13.35 |
| PV UFCF | ||||||||||
| SUM PV UFCF | 166.2 | |||||||||
| Long Term Growth Rate, % | 2.00 | |||||||||
| Free cash flow (T + 1) | 60 | |||||||||
| Terminal Value | 529 | |||||||||
| Present Terminal Value | 283 | |||||||||
| Enterprise Value | 449 | |||||||||
| Net Debt | -153 | |||||||||
| Equity Value | 602 | |||||||||
| Diluted Shares Outstanding, MM | 8 | |||||||||
| Equity Value Per Share | 74.55 |
What You Will Receive
- Customizable Excel Template: A fully editable Excel-based DCF Calculator featuring pre-filled financial data for Timberland Bancorp, Inc. (TSBK).
- Real-Time Data: Access to historical performance metrics and forward-looking projections (highlighted in the yellow cells).
- Flexible Forecasting: Adjust key assumptions such as revenue growth, EBITDA %, and WACC to suit your analysis.
- Instant Calculations: Quickly observe how your inputs affect Timberland Bancorp, Inc. (TSBK)'s valuation.
- Professional Resource: Designed for investors, CFOs, consultants, and financial analysts seeking in-depth analysis.
- User-Friendly Interface: Organized for clarity and simplicity, complete with step-by-step guidance.
Key Features
- Customizable Financial Inputs: Adjust essential metrics such as loan growth, net interest margin, and operating expenses.
- Instant Valuation Analysis: Automatically computes intrinsic value, NPV, and other financial metrics in real-time.
- High-Precision Results: Leverages Timberland Bancorp's actual financial data for accurate valuation insights.
- Effortless Scenario Testing: Easily evaluate various financial scenarios and analyze different outcomes.
- Efficiency Booster: Streamlines the valuation process, removing the need for intricate model development.
How It Works
- Step 1: Download the prebuilt Excel template with Timberland Bancorp, Inc.'s (TSBK) data included.
- Step 2: Explore the pre-filled sheets and familiarize yourself with the key metrics.
- Step 3: Update forecasts and assumptions in the editable yellow cells (WACC, growth, margins).
- Step 4: Instantly view recalculated results, including Timberland Bancorp, Inc.'s (TSBK) intrinsic value.
- Step 5: Make informed investment decisions or generate reports using the outputs.
Why Choose This Calculator?
- User-Friendly Interface: Tailored for both novice and experienced users.
- Customizable Inputs: Adjust parameters to suit your financial analysis needs.
- Real-Time Feedback: Observe immediate updates to Timberland Bancorp, Inc.'s (TSBK) valuation as you tweak inputs.
- Preloaded Data: Comes with Timberland Bancorp, Inc.'s (TSBK) latest financial figures for swift evaluations.
- Relied Upon by Experts: Favored by investors and analysts for making educated choices.
Who Should Use Timberland Bancorp, Inc. (TSBK)?
- Investors: Enhance your portfolio decisions with insights from a leading financial institution.
- Financial Analysts: Streamline your analysis using Timberland's comprehensive financial data and reports.
- Consultants: Leverage Timberland's resources to create impactful presentations for your clients.
- Finance Enthusiasts: Explore Timberland's performance metrics to gain a deeper understanding of banking operations.
- Educators and Students: Utilize Timberland's case studies as a valuable resource for finance education.
What the Template Contains
- Historical Data: Includes Timberland Bancorp’s past financials and baseline forecasts.
- DCF and Levered DCF Models: Detailed templates to calculate Timberland Bancorp’s intrinsic value.
- WACC Sheet: Pre-built calculations for Weighted Average Cost of Capital.
- Editable Inputs: Modify key drivers like growth rates, EBITDA %, and CAPEX assumptions.
- Quarterly and Annual Statements: A complete breakdown of Timberland Bancorp’s financials.
- Interactive Dashboard: Visualize valuation results and projections dynamically.
Disclaimer
All information, articles, and product details provided on this website are for general informational and educational purposes only. We do not claim any ownership over, nor do we intend to infringe upon, any trademarks, copyrights, logos, brand names, or other intellectual property mentioned or depicted on this site. Such intellectual property remains the property of its respective owners, and any references here are made solely for identification or informational purposes, without implying any affiliation, endorsement, or partnership.
We make no representations or warranties, express or implied, regarding the accuracy, completeness, or suitability of any content or products presented. Nothing on this website should be construed as legal, tax, investment, financial, medical, or other professional advice. In addition, no part of this site—including articles or product references—constitutes a solicitation, recommendation, endorsement, advertisement, or offer to buy or sell any securities, franchises, or other financial instruments, particularly in jurisdictions where such activity would be unlawful.
All content is of a general nature and may not address the specific circumstances of any individual or entity. It is not a substitute for professional advice or services. Any actions you take based on the information provided here are strictly at your own risk. You accept full responsibility for any decisions or outcomes arising from your use of this website and agree to release us from any liability in connection with your use of, or reliance upon, the content or products found herein.