
|
Taysha Gene Therapies ، Inc. (TSHA) DCF تقييم |
Fully Editable: Tailor To Your Needs In Excel Or Sheets
Professional Design: Trusted, Industry-Standard Templates
Investor-Approved Valuation Models
MAC/PC Compatible, Fully Unlocked
No Expertise Is Needed; Easy To Follow
Taysha Gene Therapies, Inc. (TSHA) Bundle
تبسيط تحليلك وتحسين الدقة مع حاسبة (TSHA) DCF! باستخدام بيانات حقيقية من Taysha Gene Therapies ، Inc. والافتراضات القابلة للتخصيص ، تمكنك هذه الأداة من التنبؤ وتحليل وقيمة (TSHA) مثل المستثمر المحنك.
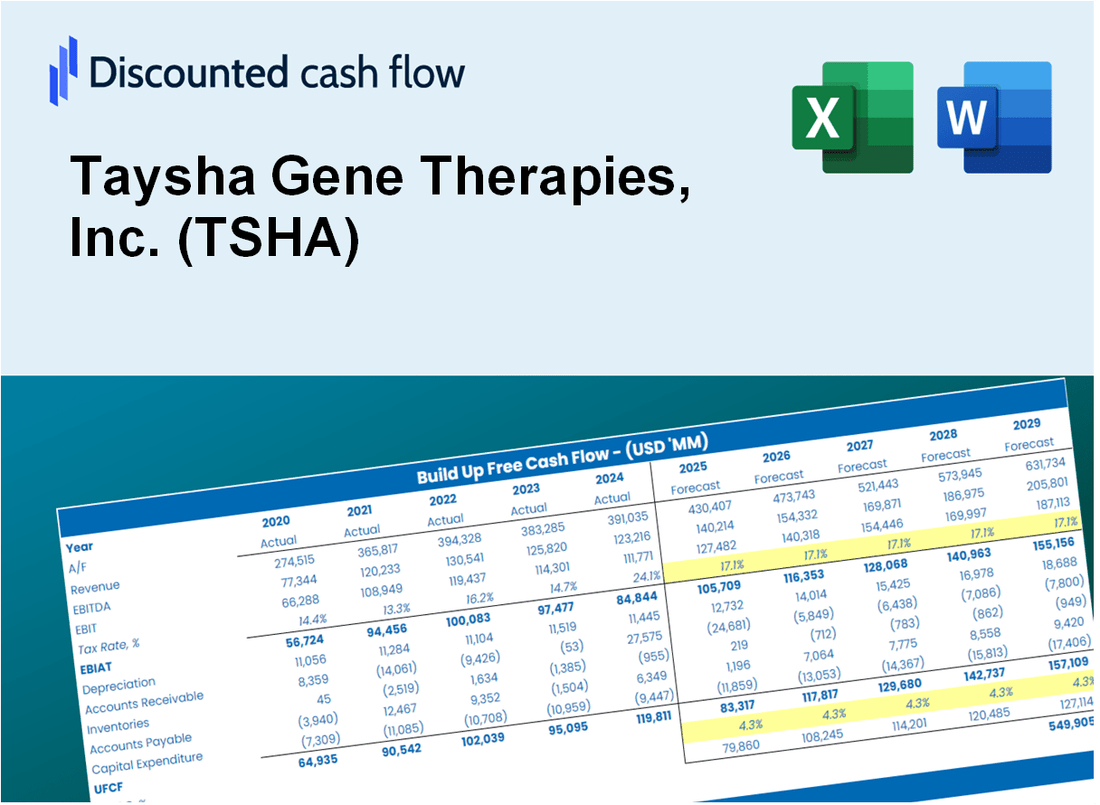
Discounted Cash Flow (DCF) - (USD MM)
| Year | AY1 2020 |
AY2 2021 |
AY3 2022 |
AY4 2023 |
AY5 2024 |
FY1 2025 |
FY2 2026 |
FY3 2027 |
FY4 2028 |
FY5 2029 |
|---|---|---|---|---|---|---|---|---|---|---|
| Revenue | .0 | .0 | 2.5 | 15.5 | 8.3 | 9.5 | 10.7 | 12.2 | 13.8 | 15.7 |
| Revenue Growth, % | 0 | 0 | 0 | 517.55 | -46.07 | 13.48 | 13.48 | 13.48 | 13.48 | 13.48 |
| EBITDA | -60.0 | -172.6 | -159.7 | -105.2 | -88.0 | -1.9 | -2.1 | -2.4 | -2.8 | -3.1 |
| EBITDA, % | 100 | 100 | -6384.05 | -680.84 | -1055.45 | -20 | -20 | -20 | -20 | -20 |
| Depreciation | .0 | .5 | 2.5 | 1.4 | 1.2 | 6.1 | 6.9 | 7.9 | 8.9 | 10.1 |
| Depreciation, % | 100 | 100 | 99.4 | 8.87 | 14.94 | 64.64 | 64.64 | 64.64 | 64.64 | 64.64 |
| EBIT | -60.0 | -173.1 | -162.2 | -106.6 | -89.2 | -1.9 | -2.1 | -2.4 | -2.8 | -3.1 |
| EBIT, % | 100 | 100 | -6483.45 | -689.72 | -1070.39 | -20 | -20 | -20 | -20 | -20 |
| Total Cash | 251.3 | 149.1 | 87.9 | 143.9 | 139.0 | 9.5 | 10.7 | 12.2 | 13.8 | 15.7 |
| Total Cash, percent | .0 | .0 | .0 | .0 | .0 | .0 | .0 | .0 | .0 | .0 |
| Account Receivables | .0 | .0 | .0 | .0 | .0 | 3.8 | 4.3 | 4.9 | 5.5 | 6.3 |
| Account Receivables, % | 100 | 100 | 0 | 0 | 0 | 40 | 40 | 40 | 40 | 40 |
| Inventories | .0 | .0 | .0 | .0 | .0 | 3.8 | 4.3 | 4.9 | 5.5 | 6.3 |
| Inventories, % | 100 | 100 | 0 | 0 | 0 | 40 | 40 | 40 | 40 | 40 |
| Accounts Payable | 2.0 | 21.8 | 10.9 | 6.4 | 3.6 | 7.3 | 8.2 | 9.4 | 10.6 | 12.1 |
| Accounts Payable, % | 100 | 100 | 437.49 | 41.2 | 43.11 | 76.86 | 76.86 | 76.86 | 76.86 | 76.86 |
| Capital Expenditure | -9.1 | -21.6 | -24.9 | -7.4 | -.4 | -2.9 | -3.3 | -3.7 | -4.2 | -4.8 |
| Capital Expenditure, % | 100 | 100 | -993.96 | -47.69 | -4.49 | -30.44 | -30.44 | -30.44 | -30.44 | -30.44 |
| Tax Rate, % | 0 | 0 | 0 | 0 | 0 | 0 | 0 | 0 | 0 | 0 |
| EBITAT | -43.0 | -173.1 | -162.2 | -106.6 | -89.2 | -1.8 | -2.0 | -2.3 | -2.6 | -3.0 |
| Depreciation | ||||||||||
| Changes in Account Receivables | ||||||||||
| Changes in Inventories | ||||||||||
| Changes in Accounts Payable | ||||||||||
| Capital Expenditure | ||||||||||
| UFCF | -50.1 | -174.4 | -195.4 | -117.1 | -91.1 | -2.4 | 1.6 | 1.8 | 2.1 | 2.3 |
| WACC, % | 8.25 | 8.31 | 8.31 | 8.31 | 8.31 | 8.3 | 8.3 | 8.3 | 8.3 | 8.3 |
| PV UFCF | ||||||||||
| SUM PV UFCF | 3.6 | |||||||||
| Long Term Growth Rate, % | 2.00 | |||||||||
| Free cash flow (T + 1) | 2 | |||||||||
| Terminal Value | 38 | |||||||||
| Present Terminal Value | 26 | |||||||||
| Enterprise Value | 29 | |||||||||
| Net Debt | -76 | |||||||||
| Equity Value | 105 | |||||||||
| Diluted Shares Outstanding, MM | 250 | |||||||||
| Equity Value Per Share | 0.42 |
What You Will Get
- Editable Excel Template: A fully customizable Excel-based DCF Calculator featuring pre-filled real TSHA financials.
- Real-World Data: Historical data and forward-looking estimates (as indicated in the yellow cells).
- Forecast Flexibility: Adjust forecast assumptions such as revenue growth, EBITDA %, and WACC.
- Automatic Calculations: Instantly observe the impact of your inputs on Taysha Gene Therapies’ valuation.
- Professional Tool: Designed for investors, CFOs, consultants, and financial analysts.
- User-Friendly Design: Organized for clarity and ease of use, complete with step-by-step instructions.
Key Features
- Comprehensive Data: Taysha Gene Therapies’ historical financial statements and pre-filled forecasts.
- Customizable Inputs: Modify WACC, tax rates, revenue growth, and EBITDA margins as needed.
- Real-Time Calculations: Observe Taysha Gene Therapies’ intrinsic value update instantly.
- Intuitive Visualizations: Dashboard graphs present valuation results and essential metrics clearly.
- Designed for Precision: A robust tool tailored for analysts, investors, and finance professionals.
How It Works
- Download: Access the ready-to-use Excel file with Taysha Gene Therapies' (TSHA) financial data.
- Customize: Adjust forecasts, including revenue growth, EBITDA %, and WACC.
- Update Automatically: The intrinsic value and NPV calculations update in real-time.
- Test Scenarios: Create multiple projections and compare outcomes instantly.
- Make Decisions: Use the valuation results to guide your investment strategy.
Why Choose Taysha Gene Therapies, Inc. (TSHA)?
- Innovative Solutions: Pioneering gene therapies that address unmet medical needs.
- Expertise in Genetics: A team of leading scientists dedicated to advancing genetic medicine.
- Patient-Centric Approach: Focused on developing treatments that enhance patient outcomes.
- Robust Pipeline: A diverse range of therapies in various stages of development.
- Commitment to Quality: Adherence to the highest standards in research and clinical trials.
Who Should Use Taysha Gene Therapies, Inc. (TSHA)?
- Investors: Gain insights into gene therapy investments with our advanced research tools.
- Researchers: Utilize comprehensive data to support innovative gene therapy projects.
- Healthcare Professionals: Stay informed about the latest developments in gene therapies for patient care.
- Biotech Enthusiasts: Explore the cutting-edge of genetic medicine and its potential impact.
- Students and Educators: Leverage our resources for studies in biotechnology and gene therapy applications.
What the Template Contains
- Pre-Filled Data: Includes Taysha Gene Therapies' historical financials and projections.
- Discounted Cash Flow Model: Editable DCF valuation model with automated calculations.
- Weighted Average Cost of Capital (WACC): A dedicated sheet for calculating WACC based on user-defined inputs.
- Key Financial Ratios: Evaluate Taysha's profitability, efficiency, and leverage metrics.
- Customizable Inputs: Easily modify revenue growth, margins, and tax rates.
- Clear Dashboard: Visual representations and tables summarizing key valuation outcomes.
Disclaimer
All information, articles, and product details provided on this website are for general informational and educational purposes only. We do not claim any ownership over, nor do we intend to infringe upon, any trademarks, copyrights, logos, brand names, or other intellectual property mentioned or depicted on this site. Such intellectual property remains the property of its respective owners, and any references here are made solely for identification or informational purposes, without implying any affiliation, endorsement, or partnership.
We make no representations or warranties, express or implied, regarding the accuracy, completeness, or suitability of any content or products presented. Nothing on this website should be construed as legal, tax, investment, financial, medical, or other professional advice. In addition, no part of this site—including articles or product references—constitutes a solicitation, recommendation, endorsement, advertisement, or offer to buy or sell any securities, franchises, or other financial instruments, particularly in jurisdictions where such activity would be unlawful.
All content is of a general nature and may not address the specific circumstances of any individual or entity. It is not a substitute for professional advice or services. Any actions you take based on the information provided here are strictly at your own risk. You accept full responsibility for any decisions or outcomes arising from your use of this website and agree to release us from any liability in connection with your use of, or reliance upon, the content or products found herein.