
|
United Parcel Service ، Inc. (UPS) DCF تقييم |
Fully Editable: Tailor To Your Needs In Excel Or Sheets
Professional Design: Trusted, Industry-Standard Templates
Investor-Approved Valuation Models
MAC/PC Compatible, Fully Unlocked
No Expertise Is Needed; Easy To Follow
United Parcel Service, Inc. (UPS) Bundle
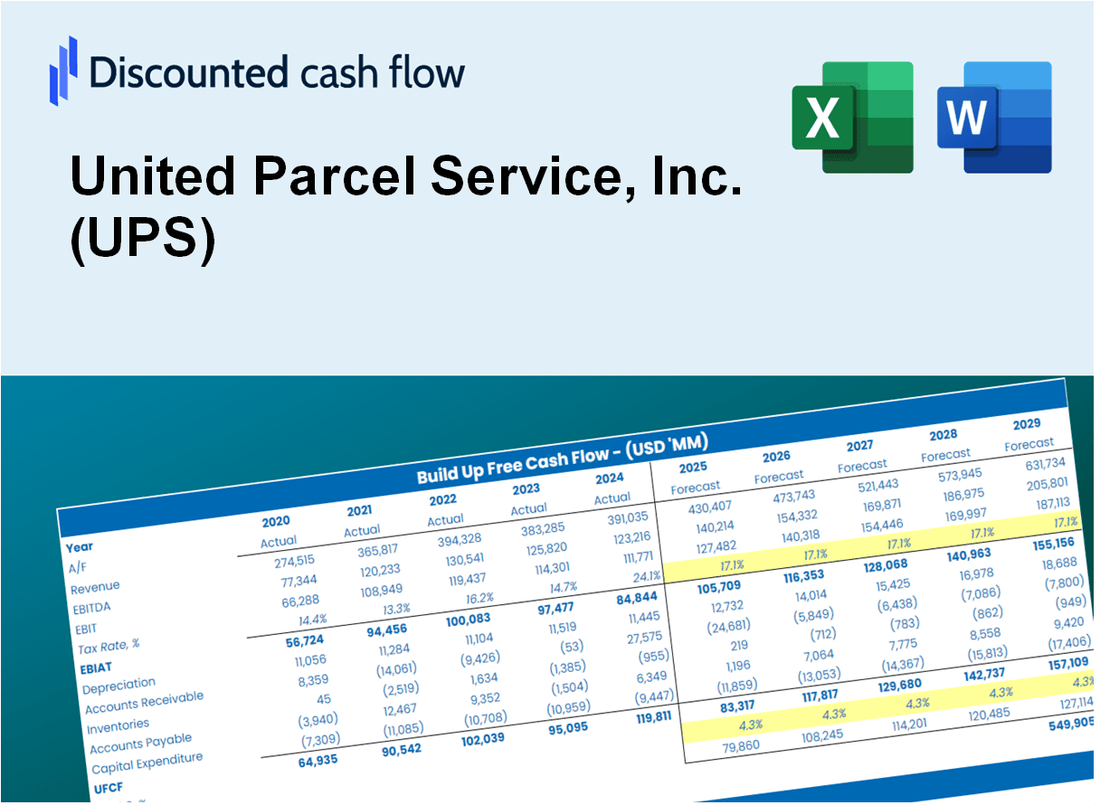
تم تصميم حاسبة DCF الخاصة بنا (UPS) الخاصة بنا ، بتقييم تقييم United Parcel Service ، Inc. مع البيانات المالية في العالم الحقيقي ومرونة كاملة لتعديل جميع المعلمات الرئيسية للتوقعات المحسنة.
Discounted Cash Flow (DCF) - (USD MM)
| Year | AY1 2020 |
AY2 2021 |
AY3 2022 |
AY4 2023 |
AY5 2024 |
FY1 2025 |
FY2 2026 |
FY3 2027 |
FY4 2028 |
FY5 2029 |
|---|---|---|---|---|---|---|---|---|---|---|
| Revenue | 84,432.0 | 97,204.0 | 100,034.0 | 90,745.0 | 90,894.0 | 92,920.2 | 94,991.6 | 97,109.1 | 99,273.8 | 101,486.8 |
| Revenue Growth, % | 0 | 15.13 | 2.91 | -9.29 | 0.1642 | 2.23 | 2.23 | 2.23 | 2.23 | 2.23 |
| EBITDA | 5,226.0 | 20,231.0 | 18,707.0 | 12,714.0 | 11,912.0 | 13,532.8 | 13,834.4 | 14,142.8 | 14,458.1 | 14,780.4 |
| EBITDA, % | 6.19 | 20.81 | 18.7 | 14.01 | 13.11 | 14.56 | 14.56 | 14.56 | 14.56 | 14.56 |
| Depreciation | 2,698.0 | 2,953.0 | 3,188.0 | 3,366.0 | 3,609.0 | 3,177.9 | 3,248.7 | 3,321.2 | 3,395.2 | 3,470.9 |
| Depreciation, % | 3.2 | 3.04 | 3.19 | 3.71 | 3.97 | 3.42 | 3.42 | 3.42 | 3.42 | 3.42 |
| EBIT | 2,528.0 | 17,278.0 | 15,519.0 | 9,348.0 | 8,303.0 | 10,354.8 | 10,585.7 | 10,821.7 | 11,062.9 | 11,309.5 |
| EBIT, % | 2.99 | 17.77 | 15.51 | 10.3 | 9.13 | 11.14 | 11.14 | 11.14 | 11.14 | 11.14 |
| Total Cash | 6,316.0 | 10,593.0 | 7,595.0 | 6,035.0 | 6,318.0 | 7,354.1 | 7,518.0 | 7,685.6 | 7,857.0 | 8,032.1 |
| Total Cash, percent | .0 | .0 | .0 | .0 | .0 | .0 | .0 | .0 | .0 | .0 |
| Account Receivables | 10,750.0 | 12,541.0 | 12,583.0 | 11,216.0 | 10,871.0 | 11,621.1 | 11,880.1 | 12,145.0 | 12,415.7 | 12,692.5 |
| Account Receivables, % | 12.73 | 12.9 | 12.58 | 12.36 | 11.96 | 12.51 | 12.51 | 12.51 | 12.51 | 12.51 |
| Inventories | 620.0 | 717.0 | 889.0 | 935.0 | 826.0 | 799.1 | 816.9 | 835.1 | 853.7 | 872.7 |
| Inventories, % | 0.73432 | 0.73762 | 0.8887 | 1.03 | 0.90875 | 0.85995 | 0.85995 | 0.85995 | 0.85995 | 0.85995 |
| Accounts Payable | 6,455.0 | 7,523.0 | 7,515.0 | 6,340.0 | 6,302.0 | 6,842.1 | 6,994.6 | 7,150.5 | 7,309.9 | 7,472.9 |
| Accounts Payable, % | 7.65 | 7.74 | 7.51 | 6.99 | 6.93 | 7.36 | 7.36 | 7.36 | 7.36 | 7.36 |
| Capital Expenditure | -5,412.0 | -4,194.0 | -4,769.0 | -5,158.0 | -3,909.0 | -4,734.6 | -4,840.1 | -4,948.0 | -5,058.3 | -5,171.1 |
| Capital Expenditure, % | -6.41 | -4.31 | -4.77 | -5.68 | -4.3 | -5.1 | -5.1 | -5.1 | -5.1 | -5.1 |
| Tax Rate, % | 22.31 | 22.31 | 22.31 | 22.31 | 22.31 | 22.31 | 22.31 | 22.31 | 22.31 | 22.31 |
| EBITAT | 1,841.2 | 13,420.5 | 12,088.6 | 7,314.4 | 6,450.9 | 7,959.6 | 8,137.0 | 8,318.4 | 8,503.8 | 8,693.4 |
| Depreciation | ||||||||||
| Changes in Account Receivables | ||||||||||
| Changes in Inventories | ||||||||||
| Changes in Accounts Payable | ||||||||||
| Capital Expenditure | ||||||||||
| UFCF | -5,787.8 | 11,359.5 | 10,285.6 | 5,668.4 | 6,566.9 | 6,219.8 | 6,421.3 | 6,564.4 | 6,710.8 | 6,860.4 |
| WACC, % | 7.12 | 7.16 | 7.16 | 7.17 | 7.16 | 7.15 | 7.15 | 7.15 | 7.15 | 7.15 |
| PV UFCF | ||||||||||
| SUM PV UFCF | 26,679.0 | |||||||||
| Long Term Growth Rate, % | 3.00 | |||||||||
| Free cash flow (T + 1) | 7,066 | |||||||||
| Terminal Value | 170,100 | |||||||||
| Present Terminal Value | 120,410 | |||||||||
| Enterprise Value | 147,088 | |||||||||
| Net Debt | 19,540 | |||||||||
| Equity Value | 127,548 | |||||||||
| Diluted Shares Outstanding, MM | 856 | |||||||||
| Equity Value Per Share | 149.01 |
What You Will Get
- Editable Excel Template: A fully customizable Excel-based DCF Calculator featuring pre-filled real UPS financials.
- Real-World Data: Historical data and forward-looking estimates (highlighted in the yellow cells).
- Forecast Flexibility: Adjust forecast assumptions such as revenue growth, EBITDA %, and WACC.
- Automatic Calculations: Instantly observe the effect of your inputs on UPS’s valuation.
- Professional Tool: Designed for investors, CFOs, consultants, and financial analysts.
- User-Friendly Design: Organized for clarity and ease of use, complete with step-by-step instructions.
Key Features
- Comprehensive Historical Data: UPS’s (UPS) financial statements and projected forecasts are readily available.
- Customizable Parameters: Adjust WACC, tax rates, revenue growth, and operating margins as needed.
- Real-Time Calculations: Observe UPS’s (UPS) intrinsic value update instantly.
- Intuitive Visualizations: Interactive dashboard charts illustrate valuation outcomes and essential metrics.
- Designed for Precision: A reliable resource for analysts, investors, and finance professionals.
How It Works
- Step 1: Download the Excel file.
- Step 2: Review pre-entered UPS data (historical and projected).
- Step 3: Adjust key assumptions (yellow cells) based on your analysis.
- Step 4: View automatic recalculations for UPS’s intrinsic value.
- Step 5: Use the outputs for investment decisions or reporting.
Why Choose the UPS Shipping Calculator?
- Reliability: Accurate shipping rates based on real UPS data.
- Convenience: Tailored for users to easily input and adjust shipping parameters.
- Efficiency: Eliminate the need for manual calculations and guesswork.
- Industry-Standard: Built with the expertise of logistics professionals in mind.
- Intuitive: Simple interface designed for users of all experience levels.
Who Should Use This Product?
- Investors: Accurately estimate United Parcel Service, Inc.’s (UPS) fair value before making investment decisions.
- CFOs: Leverage a professional-grade DCF model for financial reporting and analysis related to United Parcel Service, Inc. (UPS).
- Consultants: Quickly adapt the template for valuation reports for clients focused on United Parcel Service, Inc. (UPS).
- Entrepreneurs: Gain insights into financial modeling practices used by leading logistics companies like United Parcel Service, Inc. (UPS).
- Educators: Use it as a teaching tool to demonstrate valuation methodologies relevant to United Parcel Service, Inc. (UPS).
What the Template Contains
- Pre-Filled Data: Includes United Parcel Service, Inc.'s (UPS) historical financials and forecasts.
- Discounted Cash Flow Model: Editable DCF valuation model with automatic calculations.
- Weighted Average Cost of Capital (WACC): A dedicated sheet for calculating WACC based on custom inputs.
- Key Financial Ratios: Analyze United Parcel Service, Inc.'s (UPS) profitability, efficiency, and leverage.
- Customizable Inputs: Edit revenue growth, margins, and tax rates with ease.
- Clear Dashboard: Charts and tables summarizing key valuation results.
Disclaimer
All information, articles, and product details provided on this website are for general informational and educational purposes only. We do not claim any ownership over, nor do we intend to infringe upon, any trademarks, copyrights, logos, brand names, or other intellectual property mentioned or depicted on this site. Such intellectual property remains the property of its respective owners, and any references here are made solely for identification or informational purposes, without implying any affiliation, endorsement, or partnership.
We make no representations or warranties, express or implied, regarding the accuracy, completeness, or suitability of any content or products presented. Nothing on this website should be construed as legal, tax, investment, financial, medical, or other professional advice. In addition, no part of this site—including articles or product references—constitutes a solicitation, recommendation, endorsement, advertisement, or offer to buy or sell any securities, franchises, or other financial instruments, particularly in jurisdictions where such activity would be unlawful.
All content is of a general nature and may not address the specific circumstances of any individual or entity. It is not a substitute for professional advice or services. Any actions you take based on the information provided here are strictly at your own risk. You accept full responsibility for any decisions or outcomes arising from your use of this website and agree to release us from any liability in connection with your use of, or reliance upon, the content or products found herein.