
|
V-Guard Industries Limited (Vguard.ns) تقييم DCF |
Fully Editable: Tailor To Your Needs In Excel Or Sheets
Professional Design: Trusted, Industry-Standard Templates
Investor-Approved Valuation Models
MAC/PC Compatible, Fully Unlocked
No Expertise Is Needed; Easy To Follow
V-Guard Industries Limited (VGUARD.NS) Bundle
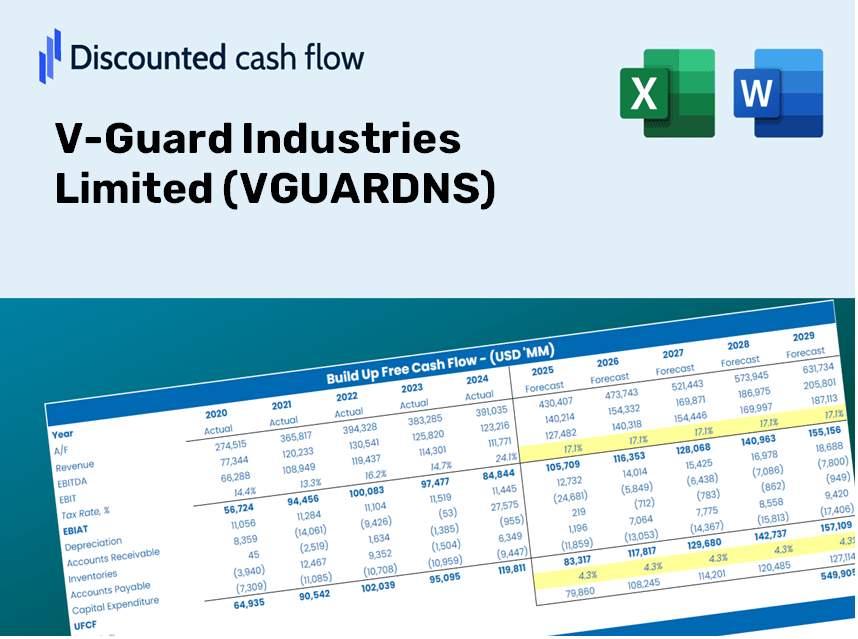
إتقان تحليل تقييم V-Guard Industries Limited (VGuardns) باستخدام حاسبة DCF المتطورة! يأتي قالب Excel هذا مسبقًا مع بيانات حقيقية (VGuardns) ، مما يمكّنك من ضبط التوقعات والافتراضات لتحديد القيمة الجوهرية لصناعات Guard Limited بدقة.
الفوائد التي ستحصل عليها
- بيانات مالية دقيقة من V-Guard: تم تحميلها مسبقًا بأرقام V-Guard Industries التاريخية والمتوقعة لتحليلها بدقة.
- قالب قابل للتخصيص بالكامل: قم بتعديل المدخلات الهامة بسهولة مثل نمو الإيرادات و WACC ونسبة الأرباح قبل الفوائد والضرائب والاستهلاك وإطفاء الدين.
- الحسابات الفورية: شاهد تحديث القيمة الجوهرية لـ V-Guard مباشرة أثناء إجراء التغييرات.
- أداة تقييم الخبراء: صُنعت للمستثمرين والمحللين والاستشاريين بهدف تحقيق نتائج DCF دقيقة.
- تصميم بديهي: تخطيط مباشر وتوجيه واضح مناسب للمستخدمين من جميع مستويات الخبرة.
الميزات الرئيسية لـ V-Guard Industries Limited (VGuardns)
- مدخلات مالية قابلة للتخصيص: اضبط المعلمات الأساسية مثل معدلات نمو الإيرادات ونسب EBITDA ومخططات الإنفاق الرأسمالي.
- تقييم DCF الفوري: يحسب بسرعة القيمة الجوهرية ، صافي القيمة الحالية (NPV) ، والمقاييس المالية الأخرى.
- دقة عالية الدقة: يعزز البيانات المالية الفعلية لـ V-Guard لنتائج التقييم الموثوقة.
- تحليل سيناريو مبسط: قم بتقييم مختلف الافتراضات وتحليل النتائج جنبًا إلى جنب.
- داعم الكفاءة: يخلط عملية التقييم ، وإزالة الحاجة إلى تطوير النموذج المعقد من الألف إلى الياء.
كيف تعمل
- قم بتنزيل القالب: الحصول على الوصول الفوري إلى حاسبة V-Guard Industries المستندة إلى Excel.
- أدخل افتراضاتك: قم بتعديل الخلايا ذات الضوء الصفراء لمعدلات النمو ، و WACC ، وهامش الربح ، وأكثر من ذلك.
- الحسابات الفورية: يقوم النموذج تلقائيًا بإعادة حساب القيمة الجوهرية لـ V-Guard.
- محاكاة السيناريوهات: استكشاف افتراضات مختلفة لتحليل التغييرات المحتملة في التقييم.
- تقييم وتقرر: الاستفادة من النتائج لإبلاغ استثمارك أو استراتيجيتك المالية.
لماذا تختار هذه الآلة الحاسبة لـ V-Guard Industries Limited (VGuardns)؟
- مصمم لقادة الصناعة: أداة متطورة يفضلها المحللون والمديرين الماليين والمستشارين.
- بيانات مالية دقيقة: البيانات المالية التاريخية والمتوقعة من V-Guard تم تحميلها مسبقًا للدقة.
- تحليل السيناريو: اختبار دون عناء التنبؤات والافتراضات.
- نتائج بديهية: يحسب تلقائيًا القيمة الجوهرية ، NPV ، والمقاييس الحيوية.
- سهل الاستخدام: تعليمات شاملة خطوة بخطوة لإرشادك من خلال الحسابات.
من يجب أن يستخدم هذا المنتج؟
- المستثمرون الأفراد: اتخاذ قرارات مستنيرة فيما يتعلق بشراء أو بيع أسهم V-Guard Industries Limited (VGuardns).
- المحللون الماليون: تعزيز سير عمل التقييم مع نماذج مالية متوفرة بسهولة مصممة لـ V-Guard Industries Limited (VGuardns).
- الاستشاريون: توفير رؤى تقييم دقيقة ودقيقة للعملاء المتمركزين حول V-Guard Industries Limited (VGuardns).
- أصحاب الأعمال: اكتساب نظرة ثاقبة على كيفية تقدير الشركات الرئيسية مثل V-Guard Industries Limited (VGuardns) لإبلاغ استراتيجيات عملك الخاصة.
- طلاب التمويل: منهجيات التقييم الرئيسية باستخدام بيانات العالم الحقيقي ودراسات الحالة من V-Guard Industries Limited (VGuardns).
ما يتضمنه القالب
- نموذج DCF المليء مسبقًا: البيانات المالية لـ V-Guard Industries تم تحصيلها مسبقًا للتطبيق الفوري.
- حاسبة WACC: حسابات شاملة لمتوسط تكلفة رأس المال المرجح.
- النسب المالية: تقييم ربحية V-Guard Industries والرافعة المالية والكفاءة التشغيلية.
- مدخلات قابلة للتحرير: تعديل الافتراضات مثل معدلات النمو والهوامش و Capex لتناسب السيناريوهات الخاصة بك.
- البيانات المالية: تقارير سنوية وفصلية للتحليل المتعمق.
- لوحة القيادة التفاعلية: تصور بسهولة مقاييس التقييم الرئيسية والنتائج.
Disclaimer
All information, articles, and product details provided on this website are for general informational and educational purposes only. We do not claim any ownership over, nor do we intend to infringe upon, any trademarks, copyrights, logos, brand names, or other intellectual property mentioned or depicted on this site. Such intellectual property remains the property of its respective owners, and any references here are made solely for identification or informational purposes, without implying any affiliation, endorsement, or partnership.
We make no representations or warranties, express or implied, regarding the accuracy, completeness, or suitability of any content or products presented. Nothing on this website should be construed as legal, tax, investment, financial, medical, or other professional advice. In addition, no part of this site—including articles or product references—constitutes a solicitation, recommendation, endorsement, advertisement, or offer to buy or sell any securities, franchises, or other financial instruments, particularly in jurisdictions where such activity would be unlawful.
All content is of a general nature and may not address the specific circumstances of any individual or entity. It is not a substitute for professional advice or services. Any actions you take based on the information provided here are strictly at your own risk. You accept full responsibility for any decisions or outcomes arising from your use of this website and agree to release us from any liability in connection with your use of, or reliance upon, the content or products found herein.