
|
V-Guard Industries Limited (VGUARD.NS) Évaluation DCF |
Entièrement Modifiable: Adapté À Vos Besoins Dans Excel Ou Sheets
Conception Professionnelle: Modèles Fiables Et Conformes Aux Normes Du Secteur
Pré-Construits Pour Une Utilisation Rapide Et Efficace
Compatible MAC/PC, entièrement débloqué
Aucune Expertise N'Est Requise; Facile À Suivre
V-Guard Industries Limited (VGUARD.NS) Bundle
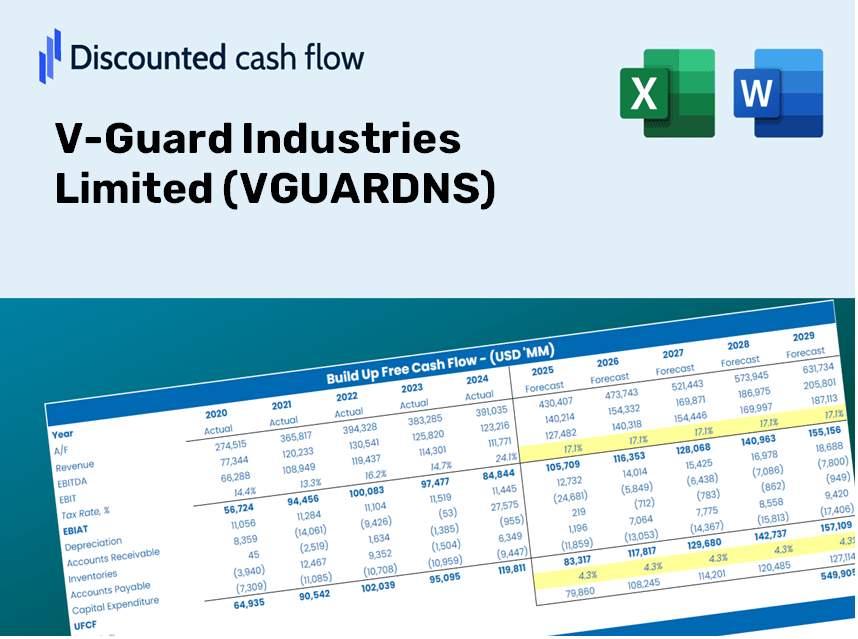
Maître l'analyse d'évaluation de V-Guard Industries Limited (VGUARDNS) à l'aide de notre calculatrice DCF de pointe! Ce modèle Excel est préchargé avec des données réelles (VGUardns), vous permettant d'ajuster les prévisions et les hypothèses pour déterminer avec précision la valeur intrinsèque de V-Guard Industries Limited.
Benefits You Will Receive
- Accurate V-Guard Financial Data: Pre-loaded with V-Guard Industries’ historical and projected figures for thorough analysis.
- Completely Customizable Template: Easily adjust critical inputs such as revenue growth, WACC, and EBITDA percentage.
- Instant Calculations: Watch V-Guard's intrinsic value update live as you make changes.
- Expert Valuation Tool: Crafted for investors, analysts, and consultants aiming for precise DCF outcomes.
- Intuitive Design: A straightforward layout and clear guidance suitable for users of all experience levels.
Key Features of V-Guard Industries Limited (VGUARDNS)
- Customizable Financial Inputs: Adjust essential parameters such as revenue growth rates, EBITDA percentages, and capital expenditure plans.
- Instant DCF Valuation: Quickly computes intrinsic value, net present value (NPV), and other financial metrics.
- High-Precision Accuracy: Leverages V-Guard's actual financial data for reliable valuation results.
- Simplified Scenario Analysis: Effortlessly evaluate various assumptions and analyze results side-by-side.
- Efficiency Booster: Streamlines the valuation process, removing the need for intricate model development from the ground up.
How It Operates
- Download the Template: Gain immediate access to the Excel-based V-Guard Industries DCF Calculator.
- Input Your Assumptions: Modify the yellow-highlighted cells for growth rates, WACC, profit margins, and more.
- Instant Calculations: The model automatically recalculates V-Guard's intrinsic value.
- Simulate Scenarios: Explore various assumptions to analyze potential changes in valuation.
- Evaluate and Decide: Utilize the outcomes to inform your investment or financial strategy.
Why Choose This Calculator for V-Guard Industries Limited (VGUARDNS)?
- Designed for Industry Leaders: A sophisticated tool favored by analysts, CFOs, and consultants.
- Accurate Financial Data: V-Guard's historical and projected financials preloaded for precision.
- Scenario Analysis: Effortlessly test various forecasts and assumptions.
- Intuitive Results: Automatically computes intrinsic value, NPV, and vital metrics.
- User-Friendly: Comprehensive step-by-step instructions to guide you through the calculations.
Who Should Use This Product?
- Individual Investors: Make well-informed decisions regarding the purchase or sale of V-Guard Industries Limited (VGUARDNS) stock.
- Financial Analysts: Enhance the valuation workflow with readily available financial models tailored for V-Guard Industries Limited (VGUARDNS).
- Consultants: Provide timely and precise valuation insights for clients centered around V-Guard Industries Limited (VGUARDNS).
- Business Owners: Gain insights into how major companies like V-Guard Industries Limited (VGUARDNS) are valued to inform your own business strategies.
- Finance Students: Master valuation methodologies using real-world data and case studies from V-Guard Industries Limited (VGUARDNS).
What the Template Includes
- Pre-Filled DCF Model: V-Guard Industries' financial data preloaded for immediate application.
- WACC Calculator: Comprehensive calculations for Weighted Average Cost of Capital.
- Financial Ratios: Assess V-Guard Industries' profitability, leverage, and operational efficiency.
- Editable Inputs: Modify assumptions such as growth rates, margins, and CAPEX to suit your scenarios.
- Financial Statements: Annual and quarterly reports for in-depth analysis.
- Interactive Dashboard: Easily visualize key valuation metrics and outcomes.
Disclaimer
All information, articles, and product details provided on this website are for general informational and educational purposes only. We do not claim any ownership over, nor do we intend to infringe upon, any trademarks, copyrights, logos, brand names, or other intellectual property mentioned or depicted on this site. Such intellectual property remains the property of its respective owners, and any references here are made solely for identification or informational purposes, without implying any affiliation, endorsement, or partnership.
We make no representations or warranties, express or implied, regarding the accuracy, completeness, or suitability of any content or products presented. Nothing on this website should be construed as legal, tax, investment, financial, medical, or other professional advice. In addition, no part of this site—including articles or product references—constitutes a solicitation, recommendation, endorsement, advertisement, or offer to buy or sell any securities, franchises, or other financial instruments, particularly in jurisdictions where such activity would be unlawful.
All content is of a general nature and may not address the specific circumstances of any individual or entity. It is not a substitute for professional advice or services. Any actions you take based on the information provided here are strictly at your own risk. You accept full responsibility for any decisions or outcomes arising from your use of this website and agree to release us from any liability in connection with your use of, or reliance upon, the content or products found herein.