
|
VEOLIA Environnement S.A (VIE.PA) DCF تقييم |
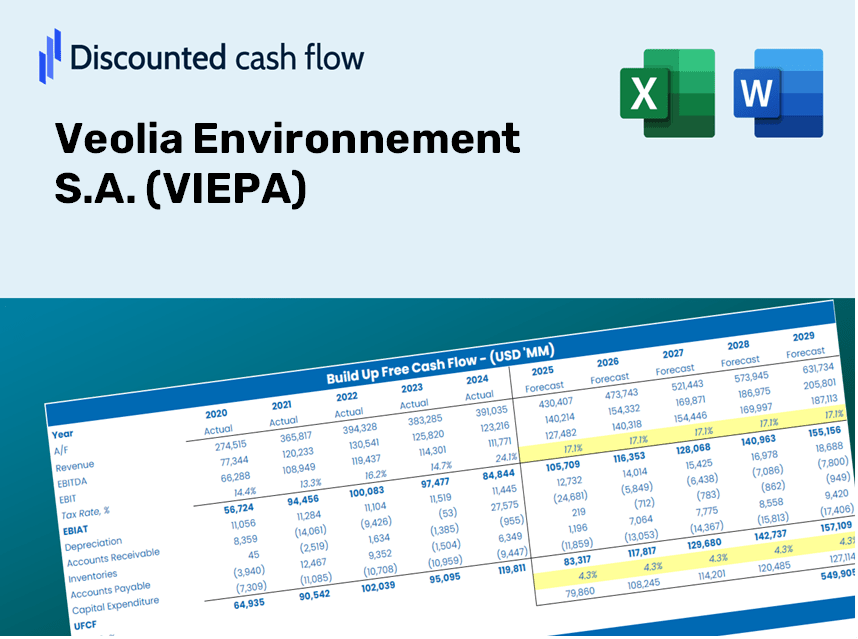
Fully Editable: Tailor To Your Needs In Excel Or Sheets
Professional Design: Trusted, Industry-Standard Templates
Investor-Approved Valuation Models
MAC/PC Compatible, Fully Unlocked
No Expertise Is Needed; Easy To Follow
Veolia Environnement S.A. (VIE.PA) Bundle
تبسيط التقييم Veolia Environnement S.A (VIEPA) مع هذه الآلة الحاسبة DCF القابلة للتخصيص! يضم Deal Voolia Environnement S.A (VIEPA) والمدخلات المتوقعة القابلة للتعديل ، يمكنك اختبار السيناريوهات وكشف Veolia Environnement S.A (VIEPA) القيمة العادلة في دقائق.
ما ستناله
- دقة VIEPA المالية: الوصول إلى البيانات التاريخية والمتوقعة للتقييم الدقيق.
- المعلمات القابلة للتخصيص: قم بتعديل WACC ومعدلات الضرائب ونمو الإيرادات والنفقات الرأسمالية حسب الحاجة.
- حسابات الوقت الفعلي: حسابات ديناميكية للقيمة الجوهرية و NPV.
- تحليل السيناريو: استكشف سيناريوهات مختلفة لتقييم أداء Veolia المستقبلي.
- تصميم سهل الاستخدام: صُنعت للمحترفين مع البقاء في متناول الوافدين الجدد.
الميزات الرئيسية
- مدخلات التنبؤ القابلة للتخصيص: اضبط المتغيرات الأساسية مثل نمو الإيرادات ، EBITDA ٪ ، والاستثمارات الرأسمالية.
- تقييم DCF التلقائي الفوري: يحسب بسرعة القيمة الجوهرية ، NPV ، والمقاييس الإضافية.
- دقة عالية الدقة: يعزز البيانات المالية الفعلية لـ Veolia لنتائج التقييم الموثوقة.
- تحليل السيناريو المبسط: تقييم دون جهد الافتراضات ومقارنة النتائج.
- داعم الكفاءة: تجنب متاعب إنشاء نماذج تقييم معقدة من الألف إلى الياء.
كيف تعمل
- الخطوة 1: قم بتنزيل ملف Excel لـ Veolia Environnement S.A (VIEPA).
- الخطوة 2: راجع البيانات المالية المملوءة مسبقًا وتوقعات Veolia.
- الخطوة 3: ضبط المدخلات الرئيسية مثل نمو الإيرادات ، WACC ، ومعدلات الضرائب (الخلايا المميزة).
- الخطوة 4: راقب تحديث نموذج DCF في الوقت الفعلي أثناء تعديل الافتراضات.
- الخطوة 5: تقييم المخرجات والاستفادة من النتائج لاستراتيجيات الاستثمار الخاصة بك.
لماذا تختار هذه الآلة الحاسبة لـ Veolia Environnement S.A (VIEPA)؟
- حل الكل في واحد: يقدم DCF و WACC وتقييمات نسبة مالية شاملة في أداة واحدة.
- مدخلات مرنة: تعديل الحقول ذات الضوء الأصفر لاستكشاف سيناريوهات مالية مختلفة.
- تحليل متعمق: يحسب تلقائيًا القيمة الجوهرية لـ Veolia والقيمة الحالية الصافية.
- المعلومات المحملة مسبقًا: الوصول إلى البيانات التاريخية والمتوقعة لتقديرات خط الأساس الموثوقة.
- معايير عالية الجودة: مثالي للمحللين الماليين والمستثمرين ومستشاري الأعمال الذين يركزون على Veolia Environnement S.A (VIEPA).
من يمكنه الاستفادة من Veolia Environnement S.A (VIEPA)؟
- المستثمرون: اتخاذ خيارات استثمار مستنيرة مع حلولنا البيئية المتقدمة.
- المحللون البيئيون: قم بتبسيط تقييماتك مع مقاييس الاستدامة المصممة مسبقًا جاهزة للتعديل.
- الاستشاريون: تخصيص مواردنا للعروض التقديمية والتقارير المؤثرة.
- حماس البيئة: عزز معرفتك بالممارسات المستدامة مع دراسات الحالة الواقعية.
- المعلمون والطلاب: الاستفادة من موادنا كمساعدات تعليمية شاملة في الدراسات البيئية.
ما يتضمنه القالب
- نموذج DCF المليء مسبقًا: VEOLIA Environnement S.A (VIEPA) البيانات المالية تم التحميل المسبق للتحليل الفوري.
- حاسبة WACC: حسابات شاملة لمتوسط تكلفة رأس المال المصمم خصيصًا لفيوليا.
- النسب المالية: تقييم ربحية Veolia والرافعة المالية والكفاءة التشغيلية.
- مدخلات قابلة للتحرير: اضبط المتغيرات مثل معدلات النمو وهامش الربح و Capex لتناسب احتياجات التحليل الخاصة بك.
- البيانات المالية: الوصول إلى التقارير السنوية والفصلية لتسهيل التقييمات المتعمقة.
- لوحة القيادة التفاعلية: تصور دون عناء مقاييس التقييم الرئيسية والنتائج.
Disclaimer
All information, articles, and product details provided on this website are for general informational and educational purposes only. We do not claim any ownership over, nor do we intend to infringe upon, any trademarks, copyrights, logos, brand names, or other intellectual property mentioned or depicted on this site. Such intellectual property remains the property of its respective owners, and any references here are made solely for identification or informational purposes, without implying any affiliation, endorsement, or partnership.
We make no representations or warranties, express or implied, regarding the accuracy, completeness, or suitability of any content or products presented. Nothing on this website should be construed as legal, tax, investment, financial, medical, or other professional advice. In addition, no part of this site—including articles or product references—constitutes a solicitation, recommendation, endorsement, advertisement, or offer to buy or sell any securities, franchises, or other financial instruments, particularly in jurisdictions where such activity would be unlawful.
All content is of a general nature and may not address the specific circumstances of any individual or entity. It is not a substitute for professional advice or services. Any actions you take based on the information provided here are strictly at your own risk. You accept full responsibility for any decisions or outcomes arising from your use of this website and agree to release us from any liability in connection with your use of, or reliance upon, the content or products found herein.