
|
Veolia Environment S.A. (VIE.PA) Évaluation DCF |
Entièrement Modifiable: Adapté À Vos Besoins Dans Excel Ou Sheets
Conception Professionnelle: Modèles Fiables Et Conformes Aux Normes Du Secteur
Pré-Construits Pour Une Utilisation Rapide Et Efficace
Compatible MAC/PC, entièrement débloqué
Aucune Expertise N'Est Requise; Facile À Suivre
Veolia Environnement S.A. (VIE.PA) Bundle
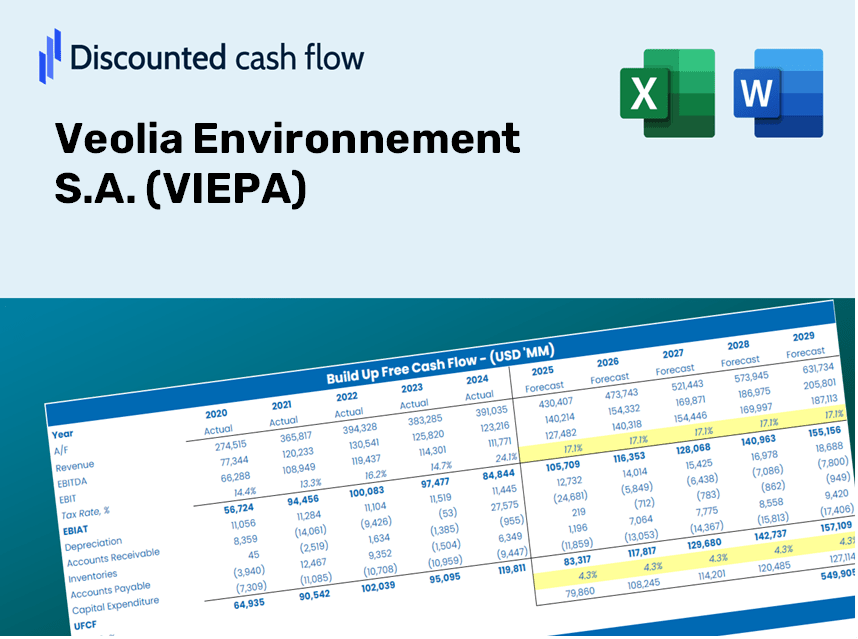
Simplifiez Veolia Environmentment S.A. (VIEPA) Valation avec cette calculatrice DCF personnalisable! Doté de Real Veolia Environment S.A. (VIEPA) Financials and Adjustable Prévision des entrées, vous pouvez tester les scénarios et découvrir la juste valeur de Veolia Environment S.A. (VIEPA) en minutes.
Discounted Cash Flow (DCF) - (USD MM)
| Year | AY1 2020 |
AY2 2021 |
AY3 2022 |
AY4 2023 |
AY5 2024 |
FY1 2025 |
FY2 2026 |
FY3 2027 |
FY4 2028 |
FY5 2029 |
|---|---|---|---|---|---|---|---|---|---|---|
| Revenue | 26,009.9 | 28,508.1 | 42,885.3 | 45,351.0 | 44,692.0 | 43,611.2 | 42,556.5 | 41,527.4 | 40,523.1 | 39,543.1 |
| Revenue Growth, % | 0 | 9.6 | 50.43 | 5.75 | -1.45 | -2.42 | -2.42 | -2.42 | -2.42 | -2.42 |
| EBITDA | 2,512.8 | 3,092.9 | 4,999.6 | 5,864.0 | 6,020.0 | 5,108.5 | 4,984.9 | 4,864.4 | 4,746.8 | 4,632.0 |
| EBITDA, % | 9.66 | 10.85 | 11.66 | 12.93 | 13.47 | 11.71 | 11.71 | 11.71 | 11.71 | 11.71 |
| Depreciation | 1,553.1 | 1,666.9 | 3,090.3 | 3,098.0 | 2,996.0 | 2,839.9 | 2,771.2 | 2,704.2 | 2,638.8 | 2,575.0 |
| Depreciation, % | 5.97 | 5.85 | 7.21 | 6.83 | 6.7 | 6.51 | 6.51 | 6.51 | 6.51 | 6.51 |
| EBIT | 959.7 | 1,426.0 | 1,909.3 | 2,766.0 | 3,024.0 | 2,268.6 | 2,213.7 | 2,160.2 | 2,108.0 | 2,057.0 |
| EBIT, % | 3.69 | 5 | 4.45 | 6.1 | 6.77 | 5.2 | 5.2 | 5.2 | 5.2 | 5.2 |
| Total Cash | 6,840.7 | 11,958.2 | 10,863.2 | 10,786.0 | 11,764.0 | 12,532.4 | 12,229.4 | 11,933.6 | 11,645.0 | 11,363.4 |
| Total Cash, percent | .0 | .0 | .0 | .0 | .0 | .0 | .0 | .0 | .0 | .0 |
| Account Receivables | 9,351.5 | 10,225.8 | 15,078.8 | 11,150.0 | 12,582.0 | 13,931.4 | 13,594.5 | 13,265.7 | 12,944.9 | 12,631.9 |
| Account Receivables, % | 35.95 | 35.87 | 35.16 | 24.59 | 28.15 | 31.94 | 31.94 | 31.94 | 31.94 | 31.94 |
| Inventories | 797.7 | 816.3 | 1,486.2 | 1,550.0 | 1,497.0 | 1,409.8 | 1,375.7 | 1,342.4 | 1,310.0 | 1,278.3 |
| Inventories, % | 3.07 | 2.86 | 3.47 | 3.42 | 3.35 | 3.23 | 3.23 | 3.23 | 3.23 | 3.23 |
| Accounts Payable | 4,504.5 | 5,457.1 | 8,081.0 | 7,960.0 | 7,673.0 | 7,852.2 | 7,662.3 | 7,477.0 | 7,296.2 | 7,119.7 |
| Accounts Payable, % | 17.32 | 19.14 | 18.84 | 17.55 | 17.17 | 18 | 18 | 18 | 18 | 18 |
| Capital Expenditure | -1,608.6 | -1,728.8 | -2,783.6 | -3,140.0 | -2,965.0 | -2,817.1 | -2,749.0 | -2,682.5 | -2,617.6 | -2,554.3 |
| Capital Expenditure, % | -6.18 | -6.06 | -6.49 | -6.92 | -6.63 | -6.46 | -6.46 | -6.46 | -6.46 | -6.46 |
| Tax Rate, % | 48.11 | 48.11 | 48.11 | 48.11 | 48.11 | 48.11 | 48.11 | 48.11 | 48.11 | 48.11 |
| EBITAT | 233.2 | 640.1 | 1,373.5 | 1,386.7 | 1,569.2 | 1,103.2 | 1,076.6 | 1,050.5 | 1,025.1 | 1,000.3 |
| Depreciation | ||||||||||
| Changes in Account Receivables | ||||||||||
| Changes in Inventories | ||||||||||
| Changes in Accounts Payable | ||||||||||
| Capital Expenditure | ||||||||||
| UFCF | -5,467.0 | 637.9 | -1,218.8 | 5,088.7 | -65.8 | 43.0 | 1,279.9 | 1,249.0 | 1,218.8 | 1,189.3 |
| WACC, % | 5.09 | 5.54 | 6.12 | 5.65 | 5.69 | 5.62 | 5.62 | 5.62 | 5.62 | 5.62 |
| PV UFCF | ||||||||||
| SUM PV UFCF | 4,132.3 | |||||||||
| Long Term Growth Rate, % | 3.00 | |||||||||
| Free cash flow (T + 1) | 1,225 | |||||||||
| Terminal Value | 46,769 | |||||||||
| Present Terminal Value | 35,583 | |||||||||
| Enterprise Value | 39,715 | |||||||||
| Net Debt | 10,364 | |||||||||
| Equity Value | 29,351 | |||||||||
| Diluted Shares Outstanding, MM | 741 | |||||||||
| Equity Value Per Share | 39.61 |
What You Will Receive
- Accurate VIEPA Financials: Access to historical and projected data for precise valuation.
- Customizable Parameters: Adjust WACC, tax rates, revenue growth, and capital expenditures as needed.
- Real-Time Calculations: Dynamic calculations of intrinsic value and NPV.
- Scenario Analysis: Explore various scenarios to assess Veolia's future performance.
- User-Friendly Design: Crafted for professionals while remaining approachable for newcomers.
Key Features
- Customizable Forecast Inputs: Adjust essential variables such as revenue growth, EBITDA %, and capital investments.
- Instant Automatic DCF Valuation: Quickly computes intrinsic value, NPV, and additional metrics.
- High-Precision Accuracy: Leverages Veolia's actual financial data for reliable valuation results.
- Streamlined Scenario Analysis: Effortlessly evaluate various assumptions and compare results.
- Efficiency Booster: Avoid the hassle of creating intricate valuation models from the ground up.
How It Works
- Step 1: Download the Excel file for Veolia Environnement S.A. (VIEPA).
- Step 2: Review the pre-filled financial data and projections for Veolia.
- Step 3: Adjust key inputs such as revenue growth, WACC, and tax rates (highlighted cells).
- Step 4: Observe the DCF model refresh in real-time as you modify the assumptions.
- Step 5: Evaluate the outputs and leverage the results for your investment strategies.
Why Choose This Calculator for Veolia Environnement S.A. (VIEPA)?
- All-in-One Solution: Offers DCF, WACC, and comprehensive financial ratio assessments in a single tool.
- Flexible Inputs: Modify the yellow-highlighted fields to explore different financial scenarios.
- In-Depth Analysis: Automatically computes Veolia's intrinsic value and Net Present Value.
- Preloaded Information: Access historical and projected data for reliable baseline estimates.
- High-Quality Standards: Perfect for financial analysts, investors, and business consultants focusing on Veolia Environnement S.A. (VIEPA).
Who Can Benefit from Veolia Environnement S.A. (VIEPA)?
- Investors: Make informed investment choices with our advanced environmental solutions.
- Environmental Analysts: Streamline your assessments with pre-designed sustainability metrics ready for modification.
- Consultants: Easily tailor our resources for impactful client presentations and reports.
- Eco-enthusiasts: Enhance your knowledge of sustainable practices with real-life case studies.
- Educators and Students: Utilize our materials as a comprehensive learning aid in environmental studies.
What the Template Includes
- Pre-Filled DCF Model: Veolia Environnement S.A. (VIEPA) financial data preloaded for immediate analysis.
- WACC Calculator: Comprehensive calculations for Weighted Average Cost of Capital tailored to Veolia.
- Financial Ratios: Assess Veolia's profitability, leverage, and operational efficiency.
- Editable Inputs: Adjust variables such as growth rates, profit margins, and CAPEX to suit your analysis needs.
- Financial Statements: Access annual and quarterly reports to facilitate in-depth evaluations.
- Interactive Dashboard: Effortlessly visualize key valuation metrics and outcomes.
Disclaimer
All information, articles, and product details provided on this website are for general informational and educational purposes only. We do not claim any ownership over, nor do we intend to infringe upon, any trademarks, copyrights, logos, brand names, or other intellectual property mentioned or depicted on this site. Such intellectual property remains the property of its respective owners, and any references here are made solely for identification or informational purposes, without implying any affiliation, endorsement, or partnership.
We make no representations or warranties, express or implied, regarding the accuracy, completeness, or suitability of any content or products presented. Nothing on this website should be construed as legal, tax, investment, financial, medical, or other professional advice. In addition, no part of this site—including articles or product references—constitutes a solicitation, recommendation, endorsement, advertisement, or offer to buy or sell any securities, franchises, or other financial instruments, particularly in jurisdictions where such activity would be unlawful.
All content is of a general nature and may not address the specific circumstances of any individual or entity. It is not a substitute for professional advice or services. Any actions you take based on the information provided here are strictly at your own risk. You accept full responsibility for any decisions or outcomes arising from your use of this website and agree to release us from any liability in connection with your use of, or reliance upon, the content or products found herein.