
|
Verastem ، Inc. (VSTM) تقييم DCF |
Fully Editable: Tailor To Your Needs In Excel Or Sheets
Professional Design: Trusted, Industry-Standard Templates
Investor-Approved Valuation Models
MAC/PC Compatible, Fully Unlocked
No Expertise Is Needed; Easy To Follow
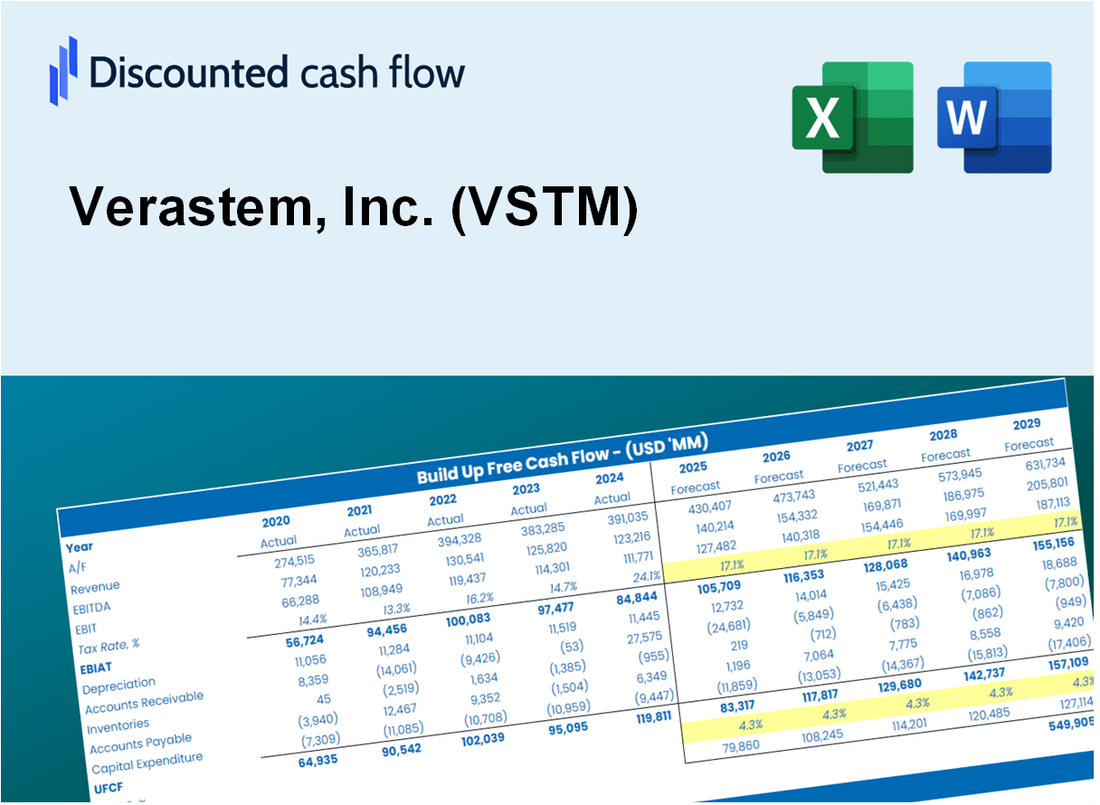
Verastem, Inc. (VSTM) Bundle
عزز استراتيجيات الاستثمار الخاصة بك مع حاسبة Verastem ، Inc. (VSTM) DCF! الاستفادة من البيانات المالية الفعلية من Verastem ، وضبط تنبؤات النمو والنفقات ، ومراقبة على الفور كيف تؤثر هذه التعديلات على القيمة الجوهرية لـ Verastem ، Inc. (VSTM).
What You Will Get
- Real VSTM Financial Data: Pre-filled with Verastem’s historical and projected data for precise analysis.
- Fully Editable Template: Modify key inputs like revenue growth, WACC, and EBITDA % with ease.
- Automatic Calculations: See Verastem’s intrinsic value update instantly based on your changes.
- Professional Valuation Tool: Designed for investors, analysts, and consultants seeking accurate DCF results.
- User-Friendly Design: Simple structure and clear instructions for all experience levels.
Key Features
- Real-Life VSTM Data: Pre-filled with Verastem’s historical financials and forward-looking projections.
- Fully Customizable Inputs: Adjust revenue growth, margins, WACC, tax rates, and capital expenditures.
- Dynamic Valuation Model: Automatic updates to Net Present Value (NPV) and intrinsic value based on your inputs.
- Scenario Testing: Create multiple forecast scenarios to analyze different valuation outcomes.
- User-Friendly Design: Simple, structured, and designed for professionals and beginners alike.
How It Works
- Step 1: Download the prebuilt Excel template with Verastem's data included.
- Step 2: Explore the pre-filled sheets and understand the key metrics.
- Step 3: Update forecasts and assumptions in the editable yellow cells (WACC, growth, margins).
- Step 4: Instantly view recalculated results, including Verastem's intrinsic value.
- Step 5: Make informed investment decisions or generate reports using the outputs.
Why Choose This Calculator for Verastem, Inc. (VSTM)?
- Accuracy: Utilizes real Verastem financial data to ensure precision.
- Flexibility: Allows users to easily test and adjust inputs as needed.
- Time-Saving: Eliminate the need to create a DCF model from the ground up.
- Professional-Grade: Crafted with the expertise and usability expected at the CFO level.
- User-Friendly: Intuitive design makes it accessible for users without extensive financial modeling skills.
Who Should Use This Product?
- Investors: Accurately estimate Verastem, Inc.'s (VSTM) fair value before making investment decisions.
- CFOs: Utilize a professional-grade DCF model for financial reporting and analysis related to Verastem, Inc. (VSTM).
- Consultants: Quickly adapt the template for valuation reports specific to Verastem, Inc. (VSTM) for clients.
- Entrepreneurs: Gain insights into financial modeling practices employed by companies like Verastem, Inc. (VSTM).
- Educators: Use it as a teaching tool to demonstrate valuation methodologies relevant to Verastem, Inc. (VSTM).
What the Template Contains
- Historical Data: Includes Verastem, Inc.'s (VSTM) past financials and baseline forecasts.
- DCF and Levered DCF Models: Detailed templates to calculate Verastem, Inc.'s (VSTM) intrinsic value.
- WACC Sheet: Pre-built calculations for Weighted Average Cost of Capital.
- Editable Inputs: Modify key drivers like growth rates, EBITDA %, and CAPEX assumptions.
- Quarterly and Annual Statements: A complete breakdown of Verastem, Inc.'s (VSTM) financials.
- Interactive Dashboard: Visualize valuation results and projections dynamically.
Disclaimer
All information, articles, and product details provided on this website are for general informational and educational purposes only. We do not claim any ownership over, nor do we intend to infringe upon, any trademarks, copyrights, logos, brand names, or other intellectual property mentioned or depicted on this site. Such intellectual property remains the property of its respective owners, and any references here are made solely for identification or informational purposes, without implying any affiliation, endorsement, or partnership.
We make no representations or warranties, express or implied, regarding the accuracy, completeness, or suitability of any content or products presented. Nothing on this website should be construed as legal, tax, investment, financial, medical, or other professional advice. In addition, no part of this site—including articles or product references—constitutes a solicitation, recommendation, endorsement, advertisement, or offer to buy or sell any securities, franchises, or other financial instruments, particularly in jurisdictions where such activity would be unlawful.
All content is of a general nature and may not address the specific circumstances of any individual or entity. It is not a substitute for professional advice or services. Any actions you take based on the information provided here are strictly at your own risk. You accept full responsibility for any decisions or outcomes arising from your use of this website and agree to release us from any liability in connection with your use of, or reliance upon, the content or products found herein.