
|
Woori Financial Group Inc. (WF) DCF تقييم |
Fully Editable: Tailor To Your Needs In Excel Or Sheets
Professional Design: Trusted, Industry-Standard Templates
Investor-Approved Valuation Models
MAC/PC Compatible, Fully Unlocked
No Expertise Is Needed; Easy To Follow
Woori Financial Group Inc. (WF) Bundle
Simplify Woori Financial Group Inc. تقييم (WF) باستخدام حاسبة DCF القابلة للتخصيص! يضم شركة Woori Financial Group Inc. (WF) المالية ومدخلات التوقعات القابلة للتعديل، يمكنك اختبار السيناريوهات والكشف عن Woori Financial Group Inc. (WF) القيمة العادلة في دقائق.
What You Will Get
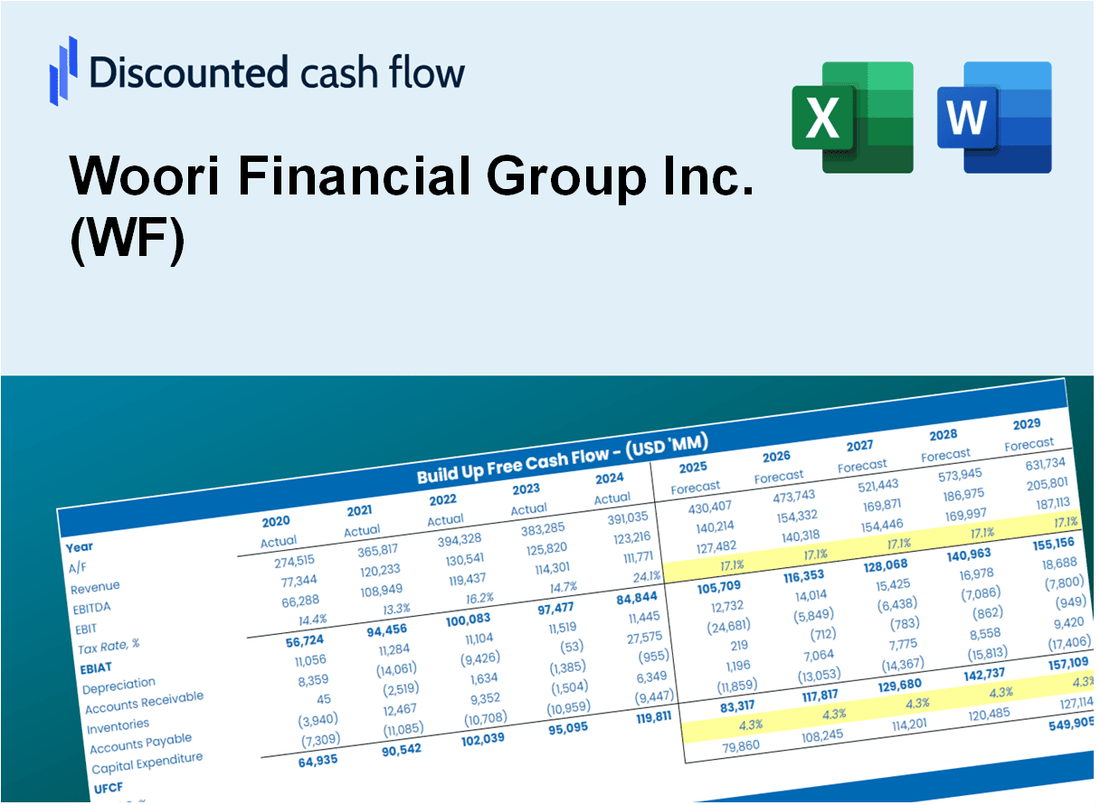
- Editable Excel Template: A fully customizable Excel-based DCF Calculator featuring pre-filled real WF financials.
- Real-World Data: Access to historical data and forward-looking estimates (highlighted in the yellow cells).
- Forecast Flexibility: Adjust forecast assumptions such as revenue growth, EBITDA %, and WACC.
- Automatic Calculations: Instantly observe the effects of your inputs on Woori Financial Group's valuation.
- Professional Tool: Designed for investors, CFOs, consultants, and financial analysts.
- User-Friendly Design: Organized for clarity and ease of use, complete with step-by-step instructions.
Key Features
- Comprehensive Financial Data: Woori Financial Group Inc.'s historical financial statements and pre-filled projections.
- Customizable Parameters: Modify WACC, tax rates, revenue growth, and EBITDA margins as needed.
- Real-Time Insights: Observe Woori Financial Group Inc.'s intrinsic value recalculating instantly.
- Intuitive Visualizations: Dashboard charts present valuation outcomes and essential metrics clearly.
- Designed for Precision: A professional-grade tool tailored for analysts, investors, and finance professionals.
How It Works
- Step 1: Download the Excel file.
- Step 2: Review Woori Financial Group Inc.'s (WF) pre-filled financial data and forecasts.
- Step 3: Modify critical inputs like revenue growth, WACC, and tax rates (highlighted cells).
- Step 4: Watch the DCF model update instantly as you tweak assumptions.
- Step 5: Analyze the outputs and use the results for investment decisions.
Why Choose This Calculator for Woori Financial Group Inc. (WF)?
- Accurate Data: Utilize precise Woori Financial Group financials for dependable valuation outcomes.
- Customizable: Modify essential parameters such as growth rates, WACC, and tax rates to align with your forecasts.
- Time-Saving: Built-in calculations streamline the process and save you from starting from scratch.
- Professional-Grade Tool: Tailored for investors, analysts, and financial consultants.
- User-Friendly: Easy-to-navigate design and step-by-step guidance ensure accessibility for all users.
Who Should Use Woori Financial Group Inc. (WF)?
- Investors: Gain insights and make informed decisions with our comprehensive financial services.
- Financial Analysts: Streamline your analysis with our robust tools and resources tailored for efficiency.
- Consultants: Easily customize our offerings to meet the specific needs of your clients.
- Finance Enthusiasts: Enhance your knowledge of financial markets and investment strategies through our expert insights.
- Educators and Students: Leverage our resources for practical applications in finance and business education.
What the Template Contains
- Preloaded WF Data: Historical and projected financial data, including revenue, EBIT, and capital expenditures.
- DCF and WACC Models: Professional-grade sheets for calculating intrinsic value and Weighted Average Cost of Capital.
- Editable Inputs: Yellow-highlighted cells for adjusting revenue growth, tax rates, and discount rates.
- Financial Statements: Comprehensive annual and quarterly financials for deeper analysis.
- Key Ratios: Profitability, leverage, and efficiency ratios to evaluate performance.
- Dashboard and Charts: Visual summaries of valuation outcomes and assumptions.
Disclaimer
All information, articles, and product details provided on this website are for general informational and educational purposes only. We do not claim any ownership over, nor do we intend to infringe upon, any trademarks, copyrights, logos, brand names, or other intellectual property mentioned or depicted on this site. Such intellectual property remains the property of its respective owners, and any references here are made solely for identification or informational purposes, without implying any affiliation, endorsement, or partnership.
We make no representations or warranties, express or implied, regarding the accuracy, completeness, or suitability of any content or products presented. Nothing on this website should be construed as legal, tax, investment, financial, medical, or other professional advice. In addition, no part of this site—including articles or product references—constitutes a solicitation, recommendation, endorsement, advertisement, or offer to buy or sell any securities, franchises, or other financial instruments, particularly in jurisdictions where such activity would be unlawful.
All content is of a general nature and may not address the specific circumstances of any individual or entity. It is not a substitute for professional advice or services. Any actions you take based on the information provided here are strictly at your own risk. You accept full responsibility for any decisions or outcomes arising from your use of this website and agree to release us from any liability in connection with your use of, or reliance upon, the content or products found herein.