
|
فنادق ويندهام & Resorts ، Inc. (WH) تقييم DCF |
Fully Editable: Tailor To Your Needs In Excel Or Sheets
Professional Design: Trusted, Industry-Standard Templates
Investor-Approved Valuation Models
MAC/PC Compatible, Fully Unlocked
No Expertise Is Needed; Easy To Follow
Wyndham Hotels & Resorts, Inc. (WH) Bundle
تقييم فنادق ويندهام & Resorts ، Inc. (WH) التوقعات المالية مثل خبير! تأتي حاسبة DCF هذه (WH) مع بيانات مالية مملوءة مسبقًا وتوفر مرونة كاملة لتعديل نمو الإيرادات و WACC والهوامش والافتراضات الأساسية الأخرى التي تتماشى مع توقعاتك.
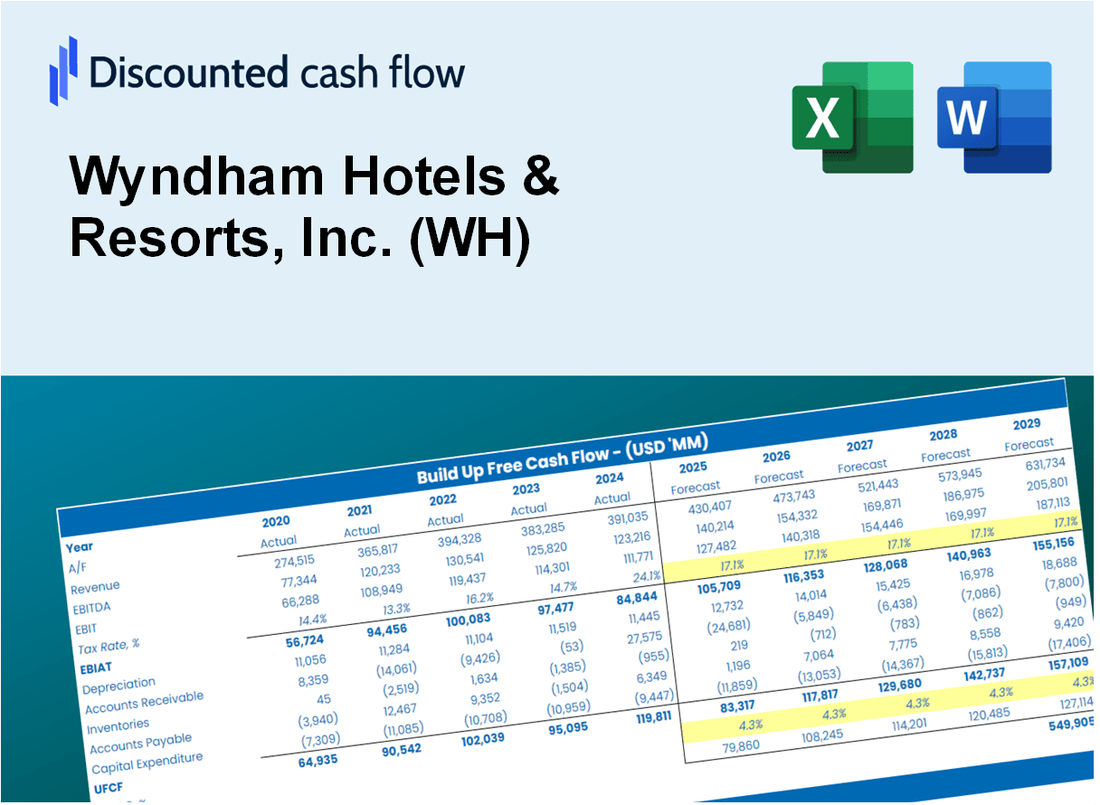
Discounted Cash Flow (DCF) - (USD MM)
| Year | AY1 2020 |
AY2 2021 |
AY3 2022 |
AY4 2023 |
AY5 2024 |
FY1 2025 |
FY2 2026 |
FY3 2027 |
FY4 2028 |
FY5 2029 |
|---|---|---|---|---|---|---|---|---|---|---|
| Revenue | 950.0 | 1,565.0 | 1,498.0 | 1,397.0 | 1,408.0 | 1,599.8 | 1,817.8 | 2,065.5 | 2,346.9 | 2,666.7 |
| Revenue Growth, % | 0 | 64.74 | -4.28 | -6.74 | 0.7874 | 13.63 | 13.63 | 13.63 | 13.63 | 13.63 |
| EBITDA | 284.0 | 524.0 | 601.0 | 582.0 | 593.0 | 599.2 | 680.9 | 773.6 | 879.0 | 998.8 |
| EBITDA, % | 29.89 | 33.48 | 40.12 | 41.66 | 42.12 | 37.45 | 37.45 | 37.45 | 37.45 | 37.45 |
| Depreciation | 98.0 | 95.0 | 77.0 | 76.0 | 71.0 | 102.4 | 116.4 | 132.2 | 150.2 | 170.7 |
| Depreciation, % | 10.32 | 6.07 | 5.14 | 5.44 | 5.04 | 6.4 | 6.4 | 6.4 | 6.4 | 6.4 |
| EBIT | 186.0 | 429.0 | 524.0 | 506.0 | 522.0 | 496.8 | 564.5 | 641.4 | 728.8 | 828.1 |
| EBIT, % | 19.58 | 27.41 | 34.98 | 36.22 | 37.07 | 31.05 | 31.05 | 31.05 | 31.05 | 31.05 |
| Total Cash | 493.0 | 171.0 | 161.0 | 66.0 | 103.0 | 273.9 | 311.2 | 353.7 | 401.8 | 456.6 |
| Total Cash, percent | .0 | .0 | .0 | .0 | .0 | .0 | .0 | .0 | .0 | .0 |
| Account Receivables | 295.0 | 246.0 | 234.0 | 241.0 | 271.0 | 316.4 | 359.5 | 408.5 | 464.2 | 527.4 |
| Account Receivables, % | 31.05 | 15.72 | 15.62 | 17.25 | 19.25 | 19.78 | 19.78 | 19.78 | 19.78 | 19.78 |
| Inventories | -67.0 | 56.0 | .0 | .0 | .0 | -11.1 | -12.6 | -14.4 | -16.3 | -18.5 |
| Inventories, % | -7.05 | 3.58 | 0 | 0 | 0 | -0.69487 | -0.69487 | -0.69487 | -0.69487 | -0.69487 |
| Accounts Payable | 28.0 | 31.0 | 39.0 | 32.0 | 37.0 | 39.8 | 45.3 | 51.4 | 58.4 | 66.4 |
| Accounts Payable, % | 2.95 | 1.98 | 2.6 | 2.29 | 2.63 | 2.49 | 2.49 | 2.49 | 2.49 | 2.49 |
| Capital Expenditure | -33.0 | -37.0 | -39.0 | -37.0 | -49.0 | -46.6 | -53.0 | -60.2 | -68.4 | -77.7 |
| Capital Expenditure, % | -3.47 | -2.36 | -2.6 | -2.65 | -3.48 | -2.91 | -2.91 | -2.91 | -2.91 | -2.91 |
| Tax Rate, % | 21.47 | 21.47 | 21.47 | 21.47 | 21.47 | 21.47 | 21.47 | 21.47 | 21.47 | 21.47 |
| EBITAT | 155.4 | 312.5 | 390.8 | 367.4 | 409.9 | 379.7 | 431.4 | 490.2 | 557.0 | 632.8 |
| Depreciation | ||||||||||
| Changes in Account Receivables | ||||||||||
| Changes in Inventories | ||||||||||
| Changes in Accounts Payable | ||||||||||
| Capital Expenditure | ||||||||||
| UFCF | 20.4 | 299.5 | 504.8 | 392.4 | 406.9 | 404.0 | 458.6 | 521.1 | 592.1 | 672.8 |
| WACC, % | 6.98 | 6.82 | 6.85 | 6.82 | 6.91 | 6.87 | 6.87 | 6.87 | 6.87 | 6.87 |
| PV UFCF | ||||||||||
| SUM PV UFCF | 2,142.8 | |||||||||
| Long Term Growth Rate, % | 3.00 | |||||||||
| Free cash flow (T + 1) | 693 | |||||||||
| Terminal Value | 17,885 | |||||||||
| Present Terminal Value | 12,827 | |||||||||
| Enterprise Value | 14,970 | |||||||||
| Net Debt | 2,363 | |||||||||
| Equity Value | 12,607 | |||||||||
| Diluted Shares Outstanding, MM | 80 | |||||||||
| Equity Value Per Share | 157.39 |
What You Will Get
- Real WH Financials: Access to historical and projected data for precise valuation.
- Customizable Inputs: Adjust WACC, tax rates, revenue growth, and capital expenditures as needed.
- Dynamic Calculations: Intrinsic value and NPV are computed in real-time.
- Scenario Analysis: Evaluate various scenarios to assess Wyndham’s future performance.
- User-Friendly Design: Designed for professionals while remaining approachable for newcomers.
Key Features
- Comprehensive Wyndham Financials: Gain access to precise pre-loaded historical data and future forecasts.
- Adjustable Forecast Parameters: Modify highlighted cells such as WACC, growth rates, and profit margins.
- Real-Time Calculations: Instant updates to DCF, Net Present Value (NPV), and cash flow assessments.
- Interactive Dashboard: User-friendly charts and summaries to help visualize your valuation outcomes.
- Designed for All Levels: An easy-to-navigate layout tailored for investors, CFOs, and consultants.
How It Works
- Step 1: Download the Excel file.
- Step 2: Review Wyndham Hotels & Resorts, Inc.'s (WH) pre-filled financial data and forecasts.
- Step 3: Modify critical inputs such as occupancy rates, ADR (Average Daily Rate), and operating expenses (highlighted cells).
- Step 4: Observe the DCF model update in real-time as you adjust your assumptions.
- Step 5: Analyze the outputs and leverage the results for your investment decisions.
Why Choose This Calculator?
- Accurate Data: Real Wyndham Hotels & Resorts financials ensure reliable valuation results.
- Customizable: Adjust key parameters like growth rates, WACC, and tax rates to match your projections.
- Time-Saving: Pre-built calculations eliminate the need to start from scratch.
- Professional-Grade Tool: Designed for investors, analysts, and consultants.
- User-Friendly: Intuitive layout and step-by-step instructions make it easy for all users.
Who Should Use This Product?
- Individual Investors: Gain insights to make informed decisions about buying or selling Wyndham Hotels & Resorts, Inc. (WH) stock.
- Financial Analysts: Enhance valuation processes with comprehensive financial models tailored for the hospitality industry.
- Consultants: Provide clients with expert valuation assessments of Wyndham Hotels & Resorts, Inc. (WH) quickly and effectively.
- Business Owners: Learn how major hotel chains like Wyndham are valued to inform your own business strategies.
- Finance Students: Explore valuation methodologies using real-world data and case studies from the hotel and resort sector.
What the Template Contains
- Pre-Filled DCF Model: Wyndham Hotels & Resorts, Inc.'s (WH) financial data preloaded for immediate use.
- WACC Calculator: Detailed calculations for Weighted Average Cost of Capital.
- Financial Ratios: Evaluate Wyndham's profitability, leverage, and efficiency.
- Editable Inputs: Change assumptions such as growth, margins, and CAPEX to fit your scenarios.
- Financial Statements: Annual and quarterly reports to support detailed analysis.
- Interactive Dashboard: Easily visualize key valuation metrics and results.
Disclaimer
All information, articles, and product details provided on this website are for general informational and educational purposes only. We do not claim any ownership over, nor do we intend to infringe upon, any trademarks, copyrights, logos, brand names, or other intellectual property mentioned or depicted on this site. Such intellectual property remains the property of its respective owners, and any references here are made solely for identification or informational purposes, without implying any affiliation, endorsement, or partnership.
We make no representations or warranties, express or implied, regarding the accuracy, completeness, or suitability of any content or products presented. Nothing on this website should be construed as legal, tax, investment, financial, medical, or other professional advice. In addition, no part of this site—including articles or product references—constitutes a solicitation, recommendation, endorsement, advertisement, or offer to buy or sell any securities, franchises, or other financial instruments, particularly in jurisdictions where such activity would be unlawful.
All content is of a general nature and may not address the specific circumstances of any individual or entity. It is not a substitute for professional advice or services. Any actions you take based on the information provided here are strictly at your own risk. You accept full responsibility for any decisions or outcomes arising from your use of this website and agree to release us from any liability in connection with your use of, or reliance upon, the content or products found herein.