
|
WSFS Financial Corporation (WSFS) تقييم DCF |
Fully Editable: Tailor To Your Needs In Excel Or Sheets
Professional Design: Trusted, Industry-Standard Templates
Investor-Approved Valuation Models
MAC/PC Compatible, Fully Unlocked
No Expertise Is Needed; Easy To Follow
WSFS Financial Corporation (WSFS) Bundle
كسب إتقان على تحليل تقييم WSFS Financial Corporation (WSFS) باستخدام حاسبة DCF المتطورة لدينا! يتميز ببيانات WSFS الحقيقية ، يمكّنك هذا القالب Excel من ضبط التوقعات والافتراضات لتحديد القيمة الجوهرية لشركة WSFS Financial (WSFS) بدقة.
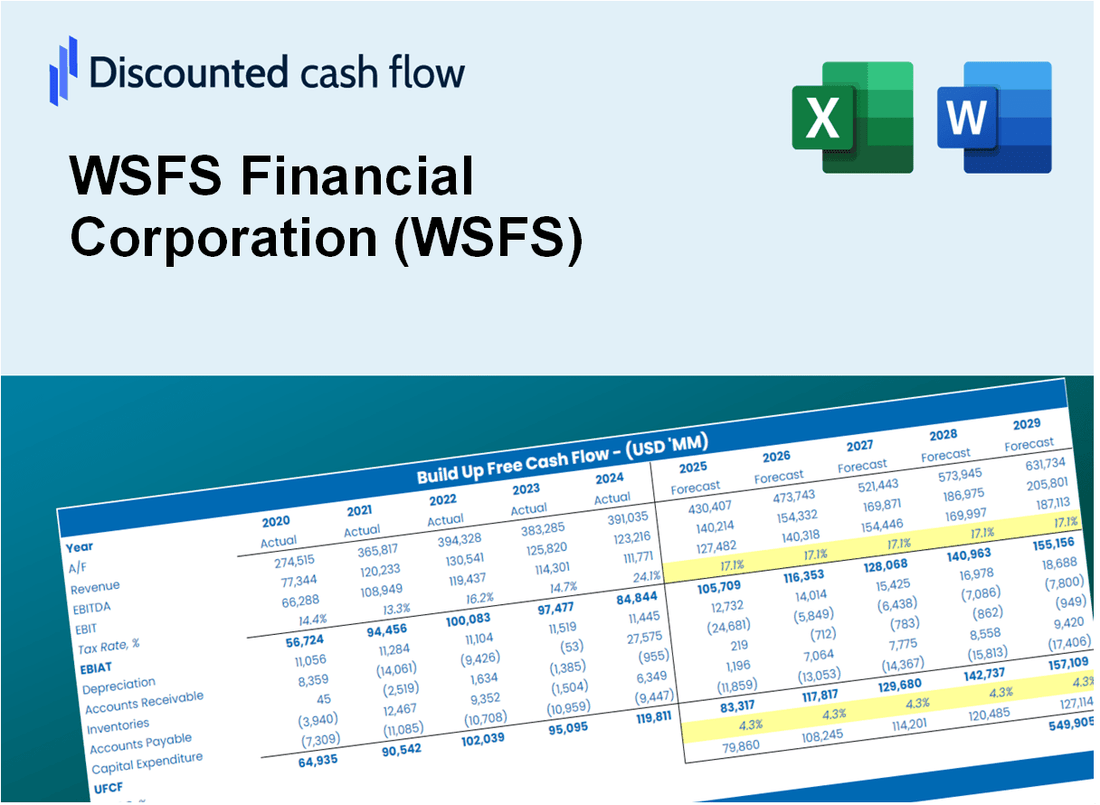
Discounted Cash Flow (DCF) - (USD MM)
| Year | AY1 2020 |
AY2 2021 |
AY3 2022 |
AY4 2023 |
AY5 2024 |
FY1 2025 |
FY2 2026 |
FY3 2027 |
FY4 2028 |
FY5 2029 |
|---|---|---|---|---|---|---|---|---|---|---|
| Revenue | 708.5 | 641.2 | 963.2 | 1,265.5 | 1,402.4 | 1,693.1 | 2,044.1 | 2,467.8 | 2,979.4 | 3,597.0 |
| Revenue Growth, % | 0 | -9.5 | 50.23 | 31.38 | 10.81 | 20.73 | 20.73 | 20.73 | 20.73 | 20.73 |
| EBITDA | 183.2 | 395.5 | 361.2 | 413.9 | 387.0 | 627.6 | 757.6 | 914.7 | 1,104.3 | 1,333.2 |
| EBITDA, % | 25.85 | 61.69 | 37.49 | 32.7 | 27.59 | 37.07 | 37.07 | 37.07 | 37.07 | 37.07 |
| Depreciation | 38.2 | 37.8 | 60.5 | 48.6 | 39.7 | 82.1 | 99.1 | 119.7 | 144.5 | 174.4 |
| Depreciation, % | 5.39 | 5.9 | 6.29 | 3.84 | 2.83 | 4.85 | 4.85 | 4.85 | 4.85 | 4.85 |
| EBIT | 145.0 | 357.7 | 300.6 | 365.3 | 347.3 | 545.4 | 658.5 | 795.0 | 959.8 | 1,158.8 |
| EBIT, % | 20.46 | 55.79 | 31.21 | 28.86 | 24.76 | 32.22 | 32.22 | 32.22 | 32.22 | 32.22 |
| Total Cash | 1,647.3 | 1,527.9 | 832.6 | 1,088.6 | 1,169.8 | 1,543.7 | 1,863.7 | 2,250.0 | 2,716.4 | 3,279.6 |
| Total Cash, percent | .0 | .0 | .0 | .0 | .0 | .0 | .0 | .0 | .0 | .0 |
| Account Receivables | 293.2 | 393.9 | 633.4 | 709.6 | 732.2 | 937.5 | 1,131.8 | 1,366.4 | 1,649.7 | 1,991.7 |
| Account Receivables, % | 41.38 | 61.43 | 65.76 | 56.07 | 52.21 | 55.37 | 55.37 | 55.37 | 55.37 | 55.37 |
| Inventories | .0 | .0 | .0 | .0 | .0 | .0 | .0 | .0 | .0 | .0 |
| Inventories, % | 0 | 0 | 0 | 0 | 0 | 0 | 0 | 0 | 0 | 0 |
| Accounts Payable | 1.5 | .7 | 5.2 | 46.7 | 38.2 | 24.6 | 29.7 | 35.9 | 43.3 | 52.3 |
| Accounts Payable, % | 0.20465 | 0.11479 | 0.53714 | 3.69 | 2.72 | 1.45 | 1.45 | 1.45 | 1.45 | 1.45 |
| Capital Expenditure | -7.2 | -6.6 | -8.8 | -6.4 | -14.3 | -15.1 | -18.3 | -22.1 | -26.7 | -32.2 |
| Capital Expenditure, % | -1.01 | -1.03 | -0.91451 | -0.50619 | -1.02 | -0.89468 | -0.89468 | -0.89468 | -0.89468 | -0.89468 |
| Tax Rate, % | 24.07 | 24.07 | 24.07 | 24.07 | 24.07 | 24.07 | 24.07 | 24.07 | 24.07 | 24.07 |
| EBITAT | 114.8 | 271.4 | 222.4 | 269.2 | 263.7 | 413.1 | 498.7 | 602.1 | 726.9 | 877.6 |
| Depreciation | ||||||||||
| Changes in Account Receivables | ||||||||||
| Changes in Inventories | ||||||||||
| Changes in Accounts Payable | ||||||||||
| Capital Expenditure | ||||||||||
| UFCF | -146.0 | 201.3 | 39.0 | 276.7 | 258.0 | 261.2 | 390.3 | 471.2 | 568.9 | 686.8 |
| WACC, % | 15.02 | 14.68 | 14.48 | 14.45 | 14.68 | 14.66 | 14.66 | 14.66 | 14.66 | 14.66 |
| PV UFCF | ||||||||||
| SUM PV UFCF | 1,513.0 | |||||||||
| Long Term Growth Rate, % | 2.00 | |||||||||
| Free cash flow (T + 1) | 701 | |||||||||
| Terminal Value | 5,534 | |||||||||
| Present Terminal Value | 2,793 | |||||||||
| Enterprise Value | 4,306 | |||||||||
| Net Debt | -770 | |||||||||
| Equity Value | 5,075 | |||||||||
| Diluted Shares Outstanding, MM | 60 | |||||||||
| Equity Value Per Share | 84.95 |
What You Will Receive
- Comprehensive Financial Model: WSFS's actual data allows for accurate DCF valuation.
- Complete Forecast Flexibility: Modify revenue growth, profit margins, WACC, and other critical factors.
- Real-Time Calculations: Instant updates ensure you observe results as adjustments are made.
- Professional-Grade Template: A polished Excel file crafted for high-quality valuation.
- Adaptable and Reusable: Designed for versatility, enabling repeated use for in-depth forecasts.
Key Features
- 🔍 Real-Life WSFS Financials: Pre-filled historical and projected data for WSFS Financial Corporation (WSFS).
- ✏️ Fully Customizable Inputs: Adjust all critical parameters (yellow cells) like WACC, growth %, and tax rates.
- 📊 Professional DCF Valuation: Built-in formulas calculate WSFS’s intrinsic value using the Discounted Cash Flow method.
- ⚡ Instant Results: Visualize WSFS’s valuation instantly after making changes.
- Scenario Analysis: Test and compare outcomes for various financial assumptions side-by-side.
How It Works
- Step 1: Download the Excel file.
- Step 2: Review WSFS Financial Corporation’s pre-filled financial data and forecasts.
- Step 3: Modify critical inputs like revenue growth, WACC, and tax rates (highlighted cells).
- Step 4: Watch the DCF model update instantly as you adjust your assumptions.
- Step 5: Analyze the outputs and leverage the results for your investment decisions.
Why Choose This Calculator for WSFS Financial Corporation (WSFS)?
- Accurate Data: Up-to-date WSFS financials provide trustworthy valuation outcomes.
- Customizable: Tailor essential parameters such as growth rates, WACC, and tax rates to align with your forecasts.
- Time-Saving: Pre-configured calculations save you the hassle of building from the ground up.
- Professional-Grade Tool: Crafted for investors, analysts, and financial consultants.
- User-Friendly: Easy-to-navigate design and clear instructions ensure accessibility for all users.
Who Should Use WSFS Financial Corporation (WSFS)?
- Investors: Leverage insights from a trusted financial institution to make informed investment choices.
- Financial Analysts: Utilize comprehensive reports and data to enhance your analytical capabilities.
- Consultants: Easily incorporate WSFS insights into your client strategies and presentations.
- Finance Enthusiasts: Explore a wealth of resources to broaden your knowledge of financial services.
- Educators and Students: Access valuable materials for teaching and learning about finance and banking.
What the Template Contains
- Pre-Filled DCF Model: WSFS Financial Corporation’s financial data preloaded for immediate use.
- WACC Calculator: Detailed calculations for Weighted Average Cost of Capital.
- Financial Ratios: Evaluate WSFS’s profitability, leverage, and efficiency.
- Editable Inputs: Change assumptions such as growth, margins, and CAPEX to fit your scenarios.
- Financial Statements: Annual and quarterly reports to support detailed analysis.
- Interactive Dashboard: Easily visualize key valuation metrics and results.
Disclaimer
All information, articles, and product details provided on this website are for general informational and educational purposes only. We do not claim any ownership over, nor do we intend to infringe upon, any trademarks, copyrights, logos, brand names, or other intellectual property mentioned or depicted on this site. Such intellectual property remains the property of its respective owners, and any references here are made solely for identification or informational purposes, without implying any affiliation, endorsement, or partnership.
We make no representations or warranties, express or implied, regarding the accuracy, completeness, or suitability of any content or products presented. Nothing on this website should be construed as legal, tax, investment, financial, medical, or other professional advice. In addition, no part of this site—including articles or product references—constitutes a solicitation, recommendation, endorsement, advertisement, or offer to buy or sell any securities, franchises, or other financial instruments, particularly in jurisdictions where such activity would be unlawful.
All content is of a general nature and may not address the specific circumstances of any individual or entity. It is not a substitute for professional advice or services. Any actions you take based on the information provided here are strictly at your own risk. You accept full responsibility for any decisions or outcomes arising from your use of this website and agree to release us from any liability in connection with your use of, or reliance upon, the content or products found herein.