
|
Williams-Sonoma ، Inc. (WSM) تقييم DCF |
Fully Editable: Tailor To Your Needs In Excel Or Sheets
Professional Design: Trusted, Industry-Standard Templates
Investor-Approved Valuation Models
MAC/PC Compatible, Fully Unlocked
No Expertise Is Needed; Easy To Follow
Williams-Sonoma, Inc. (WSM) Bundle
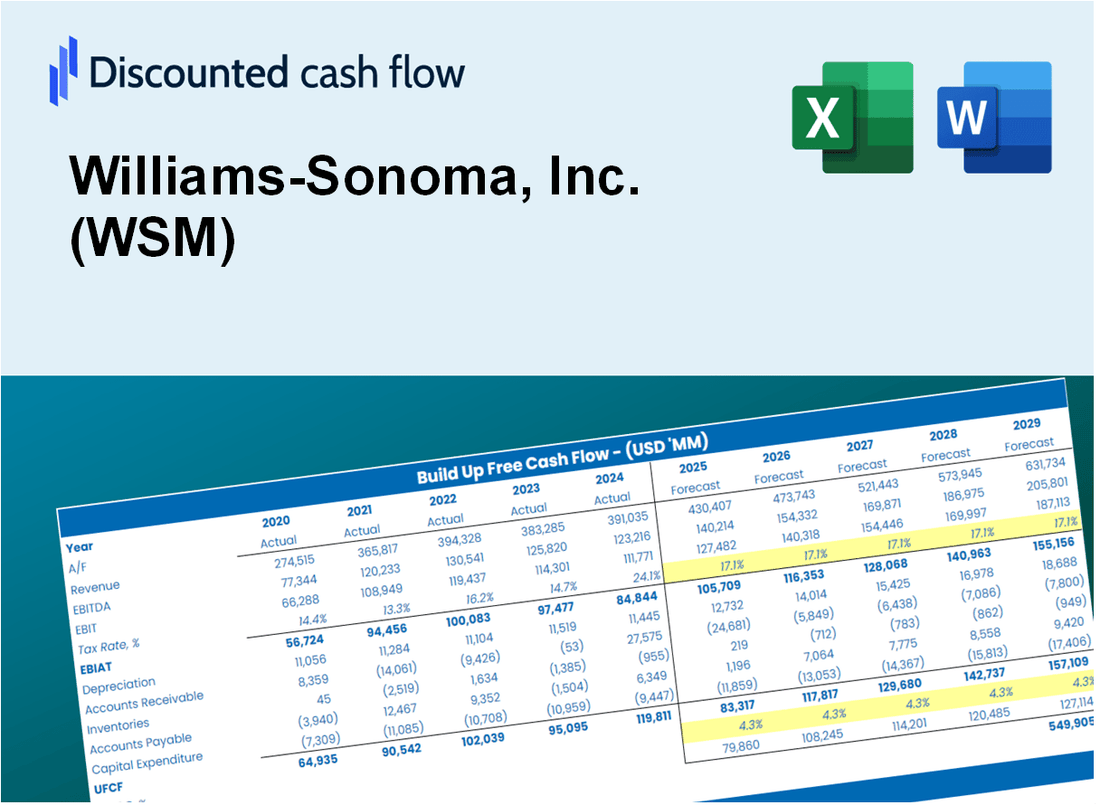
استكشف الآفاق المالية لشركة Williams-Sonoma، Inc. (WSM) باستخدام حاسبة DCF سهلة الاستخدام! أدخل افتراضاتك للنمو والهوامش والنفقات لحساب القيمة الجوهرية لشركة Williams-Sonoma، Inc. (WSM) وتعزيز استراتيجيتك الاستثمارية.
What You Will Get
- Real WSM Financial Data: Pre-filled with Williams-Sonoma’s historical and projected data for precise analysis.
- Fully Editable Template: Modify key inputs like revenue growth, WACC, and EBITDA % with ease.
- Automatic Calculations: See Williams-Sonoma’s intrinsic value update instantly based on your changes.
- Professional Valuation Tool: Designed for investors, analysts, and consultants seeking accurate DCF results.
- User-Friendly Design: Simple structure and clear instructions for all experience levels.
Key Features
- Comprehensive DCF Analysis: Features detailed unlevered and levered DCF valuation models tailored for Williams-Sonoma, Inc. (WSM).
- WACC Estimator: Pre-configured Weighted Average Cost of Capital sheet with adjustable parameters for precise calculations.
- Customizable Forecast Inputs: Easily alter growth projections, capital expenditures, and discount rates to fit your analysis.
- Integrated Financial Ratios: Evaluate profitability, leverage, and efficiency ratios specifically for Williams-Sonoma, Inc. (WSM).
- Interactive Dashboard and Visuals: Graphical representations highlight essential valuation metrics for straightforward interpretation.
How It Works
- Step 1: Download the Excel file.
- Step 2: Review pre-entered Williams-Sonoma data (historical and projected).
- Step 3: Adjust key assumptions (yellow cells) based on your analysis.
- Step 4: View automatic recalculations for Williams-Sonoma’s intrinsic value.
- Step 5: Use the outputs for investment decisions or reporting.
Why Choose This Calculator for Williams-Sonoma, Inc. (WSM)?
- Designed for Experts: A sophisticated tool utilized by financial analysts, executives, and investment consultants.
- Accurate Data: Williams-Sonoma’s historical and forecasted financial information preloaded for precision.
- Versatile Scenario Analysis: Effortlessly test various forecasts and assumptions.
- Comprehensive Outputs: Automatically computes intrinsic value, NPV, and essential financial metrics.
- User-Friendly: Step-by-step guidance ensures a smooth experience throughout the process.
Who Should Use This Product?
- Investors: Accurately evaluate Williams-Sonoma, Inc.'s (WSM) fair value prior to making investment choices.
- CFOs: Utilize a professional-grade DCF model for comprehensive financial reporting and analysis.
- Consultants: Efficiently modify the template for valuation reports tailored to clients.
- Entrepreneurs: Acquire knowledge on financial modeling techniques employed by leading home goods retailers.
- Educators: Employ it as a teaching resource to illustrate various valuation methodologies.
What the Template Contains
- Historical Data: Includes Williams-Sonoma’s past financials and baseline forecasts.
- DCF and Levered DCF Models: Detailed templates to calculate Williams-Sonoma’s intrinsic value.
- WACC Sheet: Pre-built calculations for Weighted Average Cost of Capital.
- Editable Inputs: Modify key drivers like growth rates, EBITDA %, and CAPEX assumptions.
- Quarterly and Annual Statements: A complete breakdown of Williams-Sonoma’s financials.
- Interactive Dashboard: Visualize valuation results and projections dynamically.
Disclaimer
All information, articles, and product details provided on this website are for general informational and educational purposes only. We do not claim any ownership over, nor do we intend to infringe upon, any trademarks, copyrights, logos, brand names, or other intellectual property mentioned or depicted on this site. Such intellectual property remains the property of its respective owners, and any references here are made solely for identification or informational purposes, without implying any affiliation, endorsement, or partnership.
We make no representations or warranties, express or implied, regarding the accuracy, completeness, or suitability of any content or products presented. Nothing on this website should be construed as legal, tax, investment, financial, medical, or other professional advice. In addition, no part of this site—including articles or product references—constitutes a solicitation, recommendation, endorsement, advertisement, or offer to buy or sell any securities, franchises, or other financial instruments, particularly in jurisdictions where such activity would be unlawful.
All content is of a general nature and may not address the specific circumstances of any individual or entity. It is not a substitute for professional advice or services. Any actions you take based on the information provided here are strictly at your own risk. You accept full responsibility for any decisions or outcomes arising from your use of this website and agree to release us from any liability in connection with your use of, or reliance upon, the content or products found herein.