
|
ZipRecruiter، Inc. (ZIP) تقييم DCF |
Fully Editable: Tailor To Your Needs In Excel Or Sheets
Professional Design: Trusted, Industry-Standard Templates
Investor-Approved Valuation Models
MAC/PC Compatible, Fully Unlocked
No Expertise Is Needed; Easy To Follow
ZipRecruiter, Inc. (ZIP) Bundle
تبحث لتقييم القيمة الجوهرية لـ Ziprecruiter ، Inc.؟ يدمج حاسبة ZIP DCF الخاصة بنا بيانات العالم الحقيقي مع ميزات تخصيص واسعة ، مما يتيح لك تحسين التوقعات وتعزيز استراتيجيات الاستثمار الخاصة بك.
What You Will Get
- Editable Excel Template: A fully customizable Excel-based DCF Calculator featuring pre-filled real ZIP financials.
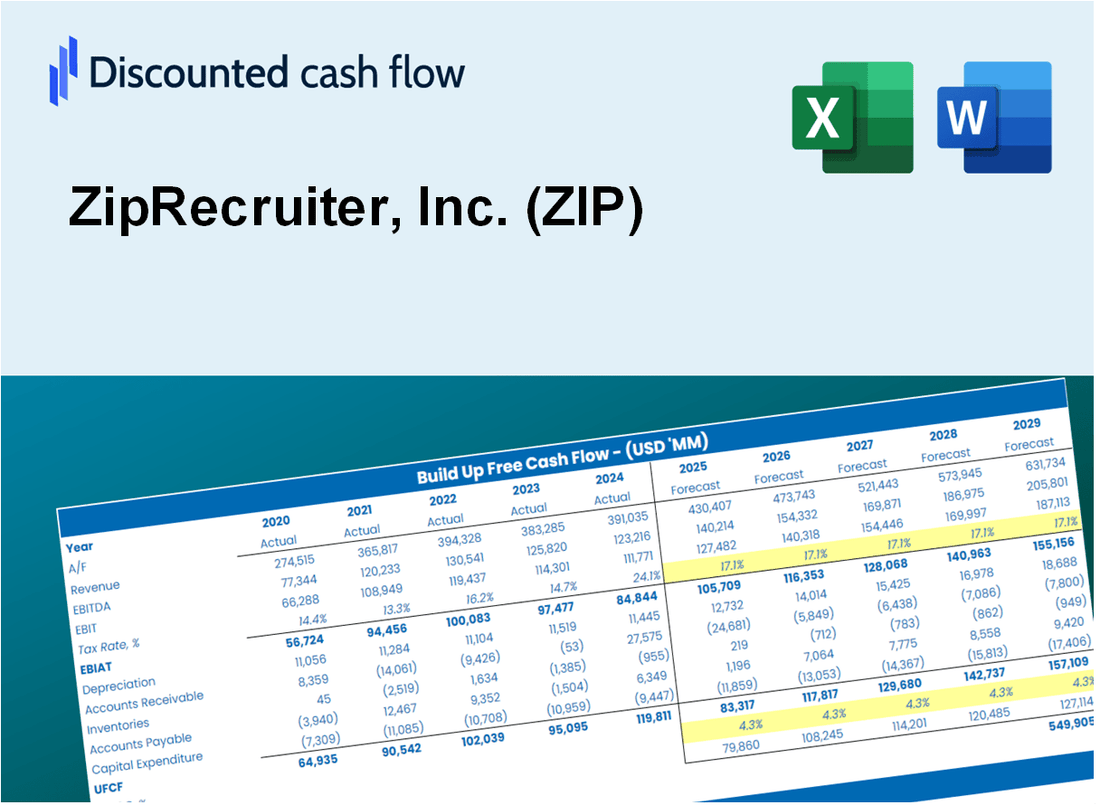
- Real-World Data: Historical data and forward-looking estimates (as highlighted in the yellow cells).
- Forecast Flexibility: Modify forecast assumptions such as revenue growth, EBITDA %, and WACC.
- Automatic Calculations: Instantly observe the effects of your inputs on ZipRecruiter’s valuation.
- Professional Tool: Designed for investors, CFOs, consultants, and financial analysts.
- User-Friendly Design: Organized for clarity and ease of use, complete with step-by-step instructions.
Key Features
- Comprehensive Job Market Analysis: Access in-depth insights into job trends and hiring patterns.
- Customizable Job Alerts: Set personalized notifications for job openings that match your criteria.
- User-Friendly Interface: Navigate easily through job listings and application processes.
- Employer Dashboard: Tools for employers to manage job postings and track candidate applications.
- Data-Driven Insights: Leverage analytics to understand job market dynamics and make informed decisions.
How It Works
- Step 1: Download the Excel file.
- Step 2: Review ZipRecruiter’s pre-filled financial data and forecasts.
- Step 3: Modify key inputs such as job growth, customer acquisition costs, and churn rates (highlighted cells).
- Step 4: Watch the DCF model update in real-time as you adjust your assumptions.
- Step 5: Analyze the outputs and leverage the results for your investment strategies.
Why Choose This Job Search Platform?
- User-Friendly Interface: Tailored for both job seekers and employers.
- Customizable Job Alerts: Set preferences to receive personalized job notifications.
- Real-Time Job Listings: Access up-to-date job openings as they become available.
- Comprehensive Resources: Equipped with tools and tips for effective job searching.
- Relied Upon by Companies: Trusted by businesses to find top talent efficiently.
Who Should Use ZipRecruiter, Inc. (ZIP)?
- Job Seekers: Find the best job opportunities tailored to your skills and experience.
- Employers: Streamline the hiring process by accessing a diverse pool of talent.
- Recruitment Agencies: Enhance client offerings with advanced job matching technology.
- Students and Graduates: Explore entry-level positions and internships to kickstart your career.
- HR Professionals: Utilize data-driven insights to improve recruitment strategies and outcomes.
What the Template Contains
- Historical Data: Includes ZipRecruiter’s past financials and baseline forecasts.
- DCF and Levered DCF Models: Detailed templates to calculate ZipRecruiter’s intrinsic value.
- WACC Sheet: Pre-built calculations for Weighted Average Cost of Capital.
- Editable Inputs: Modify key drivers like growth rates, EBITDA %, and CAPEX assumptions.
- Quarterly and Annual Statements: A complete breakdown of ZipRecruiter’s financials.
- Interactive Dashboard: Visualize valuation results and projections dynamically.
Disclaimer
All information, articles, and product details provided on this website are for general informational and educational purposes only. We do not claim any ownership over, nor do we intend to infringe upon, any trademarks, copyrights, logos, brand names, or other intellectual property mentioned or depicted on this site. Such intellectual property remains the property of its respective owners, and any references here are made solely for identification or informational purposes, without implying any affiliation, endorsement, or partnership.
We make no representations or warranties, express or implied, regarding the accuracy, completeness, or suitability of any content or products presented. Nothing on this website should be construed as legal, tax, investment, financial, medical, or other professional advice. In addition, no part of this site—including articles or product references—constitutes a solicitation, recommendation, endorsement, advertisement, or offer to buy or sell any securities, franchises, or other financial instruments, particularly in jurisdictions where such activity would be unlawful.
All content is of a general nature and may not address the specific circumstances of any individual or entity. It is not a substitute for professional advice or services. Any actions you take based on the information provided here are strictly at your own risk. You accept full responsibility for any decisions or outcomes arising from your use of this website and agree to release us from any liability in connection with your use of, or reliance upon, the content or products found herein.