
|
Shenzhen New Nanshan Holding Co., Ltd. (002314.Sz) DCF -Bewertung |
Fully Editable: Tailor To Your Needs In Excel Or Sheets
Professional Design: Trusted, Industry-Standard Templates
Investor-Approved Valuation Models
MAC/PC Compatible, Fully Unlocked
No Expertise Is Needed; Easy To Follow
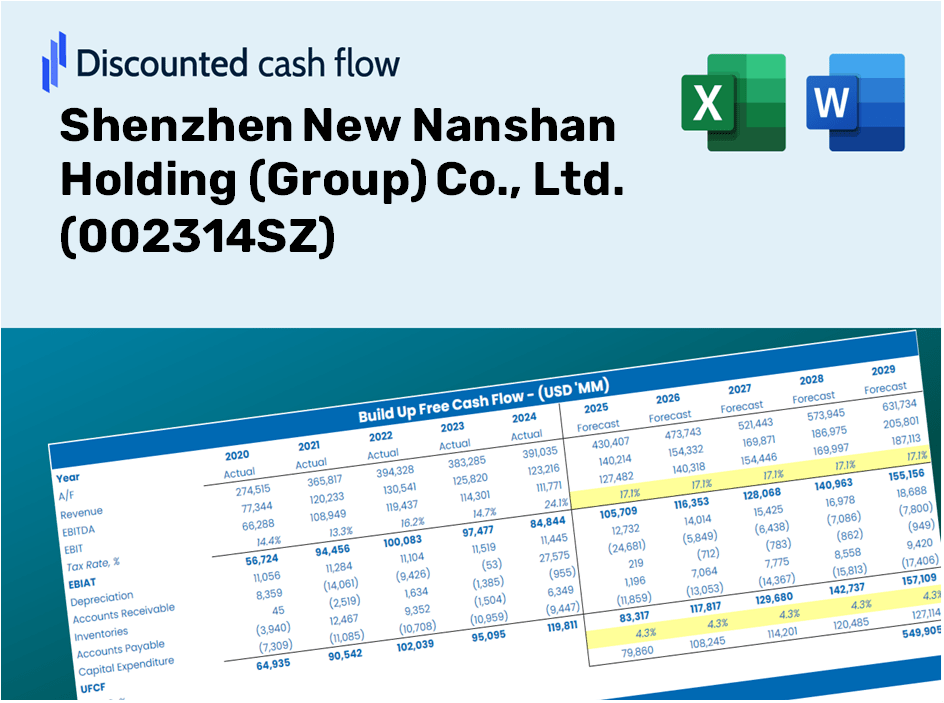
Shenzhen New Nanshan Holding (Group) Co., Ltd. (002314.SZ) Bundle
Verbessern Sie Ihre Anlagestrategien mit dem DCF -Taschenrechner (002314SZ)! Verwenden Sie authentische Finanzdaten von Shenzhen New Nanshan Holding (Group) Co., Ltd., passen Sie Wachstumsprojektionen und -kosten an und beobachten Sie sofort, wie diese Modifikationen den inneren Wert von (002314SZ) beeinflussen.
Discounted Cash Flow (DCF) - (USD MM)
| Year | AY1 2020 |
AY2 2021 |
AY3 2022 |
AY4 2023 |
AY5 2024 |
FY1 2025 |
FY2 2026 |
FY3 2027 |
FY4 2028 |
FY5 2029 |
|---|---|---|---|---|---|---|---|---|---|---|
| Revenue | 11,232.4 | 11,180.2 | 12,150.4 | 12,057.4 | 8,398.1 | 7,917.3 | 7,464.0 | 7,036.6 | 6,633.8 | 6,254.0 |
| Revenue Growth, % | 0 | -0.46459 | 8.68 | -0.7656 | -30.35 | -5.73 | -5.73 | -5.73 | -5.73 | -5.73 |
| EBITDA | 1,919.6 | 1,392.1 | 1,521.6 | 1,423.7 | 235.4 | 897.4 | 846.1 | 797.6 | 751.9 | 708.9 |
| EBITDA, % | 17.09 | 12.45 | 12.52 | 11.81 | 2.8 | 11.34 | 11.34 | 11.34 | 11.34 | 11.34 |
| Depreciation | 448.9 | 624.9 | 790.1 | 888.4 | 970.3 | 554.4 | 522.7 | 492.7 | 464.5 | 437.9 |
| Depreciation, % | 4 | 5.59 | 6.5 | 7.37 | 11.55 | 7 | 7 | 7 | 7 | 7 |
| EBIT | 1,470.7 | 767.2 | 731.5 | 535.3 | -734.9 | 343.0 | 323.4 | 304.9 | 287.4 | 271.0 |
| EBIT, % | 13.09 | 6.86 | 6.02 | 4.44 | -8.75 | 4.33 | 4.33 | 4.33 | 4.33 | 4.33 |
| Total Cash | 8,350.6 | 10,162.2 | 6,010.5 | 8,596.0 | 7,520.3 | 5,946.6 | 5,606.1 | 5,285.2 | 4,982.6 | 4,697.3 |
| Total Cash, percent | .0 | .0 | .0 | .0 | .0 | .0 | .0 | .0 | .0 | .0 |
| Account Receivables | 1,327.7 | 851.3 | 1,030.1 | 946.0 | 4,545.7 | 1,423.3 | 1,341.8 | 1,265.0 | 1,192.6 | 1,124.3 |
| Account Receivables, % | 11.82 | 7.61 | 8.48 | 7.85 | 54.13 | 17.98 | 17.98 | 17.98 | 17.98 | 17.98 |
| Inventories | 20,927.7 | 22,470.3 | 24,139.7 | 22,799.5 | 19,623.6 | 7,917.3 | 7,464.0 | 7,036.6 | 6,633.8 | 6,254.0 |
| Inventories, % | 186.32 | 200.98 | 198.67 | 189.09 | 233.67 | 100 | 100 | 100 | 100 | 100 |
| Accounts Payable | 1,959.1 | 4,164.4 | 4,134.2 | 5,129.1 | 4,764.9 | 2,976.8 | 2,806.3 | 2,645.7 | 2,494.2 | 2,351.4 |
| Accounts Payable, % | 17.44 | 37.25 | 34.03 | 42.54 | 56.74 | 37.6 | 37.6 | 37.6 | 37.6 | 37.6 |
| Capital Expenditure | -4,592.1 | -4,238.2 | -3,870.2 | -4,424.3 | -1,947.8 | -2,700.3 | -2,545.7 | -2,399.9 | -2,262.5 | -2,133.0 |
| Capital Expenditure, % | -40.88 | -37.91 | -31.85 | -36.69 | -23.19 | -34.11 | -34.11 | -34.11 | -34.11 | -34.11 |
| Tax Rate, % | -60.6 | -60.6 | -60.6 | -60.6 | -60.6 | -60.6 | -60.6 | -60.6 | -60.6 | -60.6 |
| EBITAT | 810.3 | 633.5 | 430.5 | 114.1 | -1,180.3 | 218.1 | 205.6 | 193.8 | 182.7 | 172.3 |
| Depreciation | ||||||||||
| Changes in Account Receivables | ||||||||||
| Changes in Inventories | ||||||||||
| Changes in Accounts Payable | ||||||||||
| Capital Expenditure | ||||||||||
| UFCF | -23,629.1 | -1,840.8 | -4,527.9 | -1,002.6 | -2,945.7 | 11,112.8 | -1,453.1 | -1,369.9 | -1,291.4 | -1,217.5 |
| WACC, % | 3.38 | 4.14 | 3.49 | 2.46 | 4.61 | 3.62 | 3.62 | 3.62 | 3.62 | 3.62 |
| PV UFCF | ||||||||||
| SUM PV UFCF | 6,000.4 | |||||||||
| Long Term Growth Rate, % | 2.00 | |||||||||
| Free cash flow (T + 1) | -1,242 | |||||||||
| Terminal Value | -76,821 | |||||||||
| Present Terminal Value | -64,318 | |||||||||
| Enterprise Value | -58,317 | |||||||||
| Net Debt | 16,654 | |||||||||
| Equity Value | -74,971 | |||||||||
| Diluted Shares Outstanding, MM | 2,728 | |||||||||
| Equity Value Per Share | -27.49 |
Benefits You Will Receive
- Comprehensive Financial Model: Utilize Shenzhen New Nanshan Holding’s actual data for accurate DCF valuation.
- Complete Forecasting Control: Modify revenue growth, profit margins, WACC, and other essential factors.
- Real-Time Calculations: Automatic updates provide immediate feedback as you adjust parameters.
- Professional-Grade Template: A polished Excel file crafted for high-quality valuation analysis.
- Flexible and Reusable: Designed for adaptability, perfect for performing detailed forecasts repeatedly.
Featured Highlights
- Comprehensive Historical Data: Access Shenzhen New Nanshan Holding's financial statements and expert forecasts.
- Customizable Parameters: Modify WACC, tax rates, revenue growth, and EBITDA margins to suit your needs.
- Real-Time Insights: Watch the intrinsic value of Shenzhen New Nanshan Holding ([002314SZ]) update instantly.
- Visual Analysis Tools: Dashboard visualizations present valuation outcomes and essential metrics clearly.
- Designed for Precision: A robust resource tailored for analysts, investors, and financial professionals.
How It Works
- Step 1: Download the prebuilt Excel template that includes data for Shenzhen New Nanshan Holding (Group) Co., Ltd. (002314SZ).
- Step 2: Review the pre-filled sheets to familiarize yourself with the essential metrics.
- Step 3: Update forecasts and assumptions in the editable yellow cells (WACC, growth, margins).
- Step 4: Instantly view recalculated results, including the intrinsic value of Shenzhen New Nanshan Holding (Group) Co., Ltd. (002314SZ).
- Step 5: Utilize the outputs to make informed investment decisions or generate comprehensive reports.
Why Choose This Calculator for Shenzhen New Nanshan Holding (Group) Co., Ltd. (002314SZ)?
- Reliable Insights: Utilize authentic financial data for precise valuation outcomes.
- Tailorable Parameters: Modify key variables such as growth rates, WACC, and tax rates to align with your forecasts.
- Efficiency Boost: Ready-to-use calculations save time and eliminate the need to build from the ground up.
- Expert-Level Tool: Crafted for the use of investors, analysts, and business consultants.
- Easy to Navigate: Designed with a user-friendly interface and comprehensive guides for effortless use by all.
Who Should Use This Product?
- Individual Investors: Make informed decisions about buying or selling Shenzhen New Nanshan Holding (Group) Co., Ltd. (002314SZ) stock.
- Financial Analysts: Enhance valuation processes with ready-to-use financial models specific to Shenzhen New Nanshan Holding (Group) Co., Ltd. (002314SZ).
- Consultants: Provide timely and accurate valuation insights for clients interested in Shenzhen New Nanshan Holding (Group) Co., Ltd. (002314SZ).
- Business Owners: Gain insights into how large companies like Shenzhen New Nanshan Holding (Group) Co., Ltd. (002314SZ) are valued to inform your own business strategy.
- Finance Students: Study valuation techniques using real-world data and case studies related to Shenzhen New Nanshan Holding (Group) Co., Ltd. (002314SZ).
Contents of the Template
- Pre-Filled Data: Contains Shenzhen New Nanshan Holding (Group) Co., Ltd.’s historical financial information and forecasts.
- Discounted Cash Flow Model: An editable DCF valuation model featuring automatic calculations.
- Weighted Average Cost of Capital (WACC): A specialized sheet for calculating WACC using user-defined inputs.
- Key Financial Ratios: Examine Shenzhen New Nanshan Holding’s profitability, efficiency, and leverage metrics.
- Customizable Inputs: Easily modify revenue growth, margins, and tax rates.
- Clear Dashboard: Visual representations including charts and tables summarizing essential valuation outcomes.
Disclaimer
All information, articles, and product details provided on this website are for general informational and educational purposes only. We do not claim any ownership over, nor do we intend to infringe upon, any trademarks, copyrights, logos, brand names, or other intellectual property mentioned or depicted on this site. Such intellectual property remains the property of its respective owners, and any references here are made solely for identification or informational purposes, without implying any affiliation, endorsement, or partnership.
We make no representations or warranties, express or implied, regarding the accuracy, completeness, or suitability of any content or products presented. Nothing on this website should be construed as legal, tax, investment, financial, medical, or other professional advice. In addition, no part of this site—including articles or product references—constitutes a solicitation, recommendation, endorsement, advertisement, or offer to buy or sell any securities, franchises, or other financial instruments, particularly in jurisdictions where such activity would be unlawful.
All content is of a general nature and may not address the specific circumstances of any individual or entity. It is not a substitute for professional advice or services. Any actions you take based on the information provided here are strictly at your own risk. You accept full responsibility for any decisions or outcomes arising from your use of this website and agree to release us from any liability in connection with your use of, or reliance upon, the content or products found herein.