
|
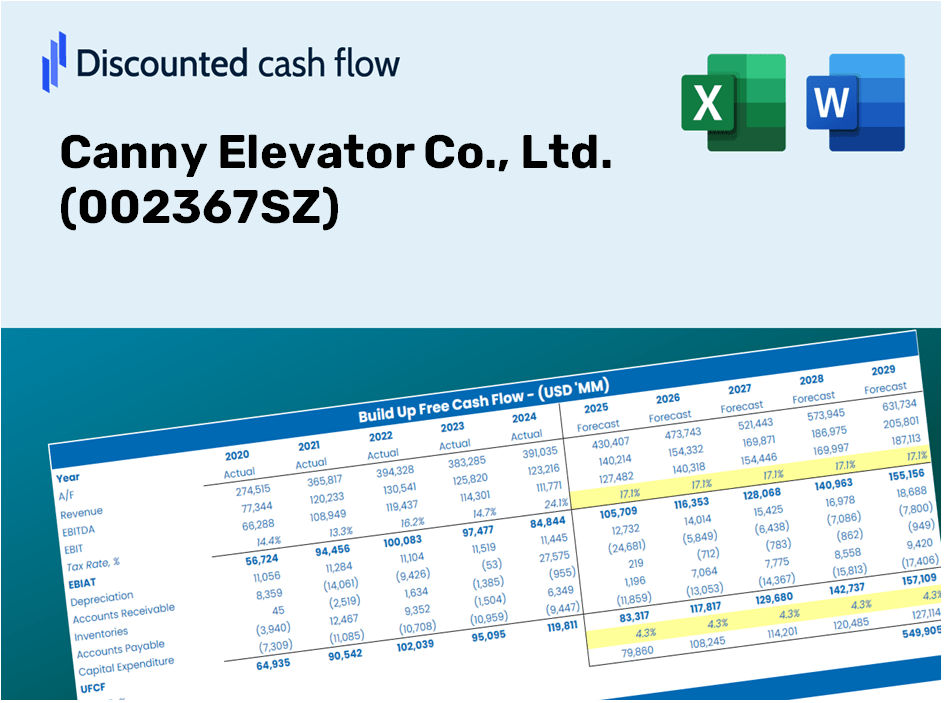
Canny Elevator Co., Ltd. (002367.sz) DCF -Bewertung |
Fully Editable: Tailor To Your Needs In Excel Or Sheets
Professional Design: Trusted, Industry-Standard Templates
Investor-Approved Valuation Models
MAC/PC Compatible, Fully Unlocked
No Expertise Is Needed; Easy To Follow
Canny Elevator Co., Ltd. (002367.SZ) Bundle
Verbessern Sie Ihre Bewertungsanalyse von Canny Elevator Co., Ltd. (002367SZ) mit unserem hochmodernen DCF-Taschenrechner! Diese Excel -Vorlage wird mit authentischen (002367SZ) Daten vorinstalliert, sodass Sie Prognosen und Annahmen für eine genaue Berechnung des intrinsischen Wertes des Canny Elevators anpassen können.
Discounted Cash Flow (DCF) - (USD MM)
| Year | AY1 2020 |
AY2 2021 |
AY3 2022 |
AY4 2023 |
AY5 2024 |
FY1 2025 |
FY2 2026 |
FY3 2027 |
FY4 2028 |
FY5 2029 |
|---|---|---|---|---|---|---|---|---|---|---|
| Revenue | 4,280.1 | 5,169.9 | 5,114.6 | 5,035.0 | 4,083.1 | 4,269.2 | 4,463.8 | 4,667.3 | 4,880.0 | 5,102.4 |
| Revenue Growth, % | 0 | 20.79 | -1.07 | -1.56 | -18.91 | 4.56 | 4.56 | 4.56 | 4.56 | 4.56 |
| EBITDA | 700.6 | 592.3 | 421.6 | 525.6 | 521.8 | 506.2 | 529.3 | 553.4 | 578.6 | 605.0 |
| EBITDA, % | 16.37 | 11.46 | 8.24 | 10.44 | 12.78 | 11.86 | 11.86 | 11.86 | 11.86 | 11.86 |
| Depreciation | 116.5 | 111.2 | 113.5 | 111.9 | 108.6 | 102.2 | 106.9 | 111.8 | 116.9 | 122.2 |
| Depreciation, % | 2.72 | 2.15 | 2.22 | 2.22 | 2.66 | 2.39 | 2.39 | 2.39 | 2.39 | 2.39 |
| EBIT | 584.1 | 481.1 | 308.1 | 413.7 | 413.1 | 404.0 | 422.4 | 441.6 | 461.8 | 482.8 |
| EBIT, % | 13.65 | 9.31 | 6.02 | 8.22 | 10.12 | 9.46 | 9.46 | 9.46 | 9.46 | 9.46 |
| Total Cash | 1,885.0 | 1,941.9 | 1,900.1 | 2,438.6 | 2,472.7 | 1,944.6 | 2,033.2 | 2,125.9 | 2,222.8 | 2,324.1 |
| Total Cash, percent | .0 | .0 | .0 | .0 | .0 | .0 | .0 | .0 | .0 | .0 |
| Account Receivables | 1,013.6 | 1,457.7 | 1,603.6 | 1,671.4 | 1,496.0 | 1,306.9 | 1,366.5 | 1,428.8 | 1,493.9 | 1,562.0 |
| Account Receivables, % | 23.68 | 28.2 | 31.35 | 33.2 | 36.64 | 30.61 | 30.61 | 30.61 | 30.61 | 30.61 |
| Inventories | 1,213.7 | 1,493.7 | 1,070.5 | 1,216.9 | 1,223.2 | 1,129.7 | 1,181.2 | 1,235.0 | 1,291.3 | 1,350.2 |
| Inventories, % | 28.36 | 28.89 | 20.93 | 24.17 | 29.96 | 26.46 | 26.46 | 26.46 | 26.46 | 26.46 |
| Accounts Payable | 1,548.0 | 2,052.5 | 1,764.4 | 1,895.5 | 1,929.0 | 1,667.2 | 1,743.2 | 1,822.6 | 1,905.7 | 1,992.6 |
| Accounts Payable, % | 36.17 | 39.7 | 34.5 | 37.65 | 47.24 | 39.05 | 39.05 | 39.05 | 39.05 | 39.05 |
| Capital Expenditure | -41.2 | -97.7 | -37.4 | -21.4 | -19.6 | -38.3 | -40.1 | -41.9 | -43.8 | -45.8 |
| Capital Expenditure, % | -0.96231 | -1.89 | -0.73195 | -0.42455 | -0.48027 | -0.89778 | -0.89778 | -0.89778 | -0.89778 | -0.89778 |
| Tax Rate, % | 12.61 | 12.61 | 12.61 | 12.61 | 12.61 | 12.61 | 12.61 | 12.61 | 12.61 | 12.61 |
| EBITAT | 491.5 | 419.0 | 279.2 | 369.5 | 361.0 | 354.3 | 370.5 | 387.4 | 405.0 | 423.5 |
| Depreciation | ||||||||||
| Changes in Account Receivables | ||||||||||
| Changes in Inventories | ||||||||||
| Changes in Accounts Payable | ||||||||||
| Capital Expenditure | ||||||||||
| UFCF | -112.5 | 212.8 | 344.5 | 377.0 | 652.6 | 439.0 | 402.2 | 420.6 | 439.7 | 459.8 |
| WACC, % | 6.08 | 6.08 | 6.09 | 6.09 | 6.09 | 6.09 | 6.09 | 6.09 | 6.09 | 6.09 |
| PV UFCF | ||||||||||
| SUM PV UFCF | 1,812.8 | |||||||||
| Long Term Growth Rate, % | 2.00 | |||||||||
| Free cash flow (T + 1) | 469 | |||||||||
| Terminal Value | 11,478 | |||||||||
| Present Terminal Value | 8,542 | |||||||||
| Enterprise Value | 10,355 | |||||||||
| Net Debt | -1,743 | |||||||||
| Equity Value | 12,098 | |||||||||
| Diluted Shares Outstanding, MM | 798 | |||||||||
| Equity Value Per Share | 15.16 |
Benefits You Will Receive
- Dynamic Forecast Variables: Effortlessly adjust assumptions (growth %, margins, WACC) to explore various scenarios.
- Up-to-Date Market Data: Canny Elevator Co., Ltd.'s financial information pre-loaded to kickstart your analysis.
- Instant DCF Calculations: The template automatically computes Net Present Value (NPV) and intrinsic value for you.
- Tailored and Professional Design: A sleek Excel model that can be customized to fit your valuation needs.
- Designed for Analysts and Investors: Perfect for assessing projections, validating strategies, and enhancing efficiency.
Key Features
- Comprehensive Data: Canny Elevator Co., Ltd.'s historical financial statements and pre-populated projections.
- Customizable Inputs: Modify WACC, tax rates, revenue growth, and EBITDA margins as needed.
- Real-Time Results: Observe the recalculation of Canny Elevator's intrinsic value instantly.
- Visual Data Representation: Dashboard graphs illustrate valuation outcomes and essential metrics.
- Designed for Precision: A specialized tool for analysts, investors, and finance professionals.
How It Works
- Step 1: Download the Excel file.
- Step 2: Examine the pre-filled data for Canny Elevator Co., Ltd. (002367SZ) (historical and projected).
- Step 3: Modify key assumptions (highlighted in yellow) according to your analysis.
- Step 4: Observe the automatic recalculations reflecting Canny Elevator Co., Ltd.'s (002367SZ) intrinsic value.
- Step 5: Utilize the results for investment decisions or reporting purposes.
Why Choose Canny Elevator Co., Ltd. (002367SZ)?
- User-Friendly Interface: Tailored for both newcomers and seasoned professionals.
- Customizable Inputs: Effortlessly adjust parameters to suit your specific needs.
- Real-Time Updates: Instantly view changes in Canny Elevator's valuation as you modify inputs.
- Preloaded Financial Data: Comes equipped with Canny Elevator's historical financial information for prompt analysis.
- Relied Upon by Experts: Favored by investors and analysts for insightful decision-making.
Who Can Benefit from Canny Elevator Co., Ltd. (002367SZ)?
- Engineering Students: Explore design principles and apply them using industry-specific data.
- Researchers: Integrate advanced elevator technologies into academic projects or studies.
- Investors: Validate your investment strategies and examine performance metrics for Canny Elevator Co., Ltd. (002367SZ).
- Market Analysts: Optimize your analysis process with a ready-to-use, adaptable financial model.
- Business Owners: Discover how major players like Canny Elevator Co., Ltd. (002367SZ) are evaluated in the market.
Contents of the Template
- Preloaded Canny Elevator Data: Historical and forecasted financial figures, including revenue, EBIT, and capital expenditures.
- DCF and WACC Models: Advanced spreadsheets designed for calculating intrinsic value and Weighted Average Cost of Capital.
- Editable Inputs: Yellow-highlighted cells for modifying revenue growth rates, tax rates, and discount rates.
- Financial Statements: Detailed annual and quarterly financial reports for in-depth analysis.
- Key Ratios: Metrics for profitability, leverage, and efficiency to assess company performance.
- Dashboard and Charts: Visual representations of valuation results and underlying assumptions.
Disclaimer
All information, articles, and product details provided on this website are for general informational and educational purposes only. We do not claim any ownership over, nor do we intend to infringe upon, any trademarks, copyrights, logos, brand names, or other intellectual property mentioned or depicted on this site. Such intellectual property remains the property of its respective owners, and any references here are made solely for identification or informational purposes, without implying any affiliation, endorsement, or partnership.
We make no representations or warranties, express or implied, regarding the accuracy, completeness, or suitability of any content or products presented. Nothing on this website should be construed as legal, tax, investment, financial, medical, or other professional advice. In addition, no part of this site—including articles or product references—constitutes a solicitation, recommendation, endorsement, advertisement, or offer to buy or sell any securities, franchises, or other financial instruments, particularly in jurisdictions where such activity would be unlawful.
All content is of a general nature and may not address the specific circumstances of any individual or entity. It is not a substitute for professional advice or services. Any actions you take based on the information provided here are strictly at your own risk. You accept full responsibility for any decisions or outcomes arising from your use of this website and agree to release us from any liability in connection with your use of, or reliance upon, the content or products found herein.