
|
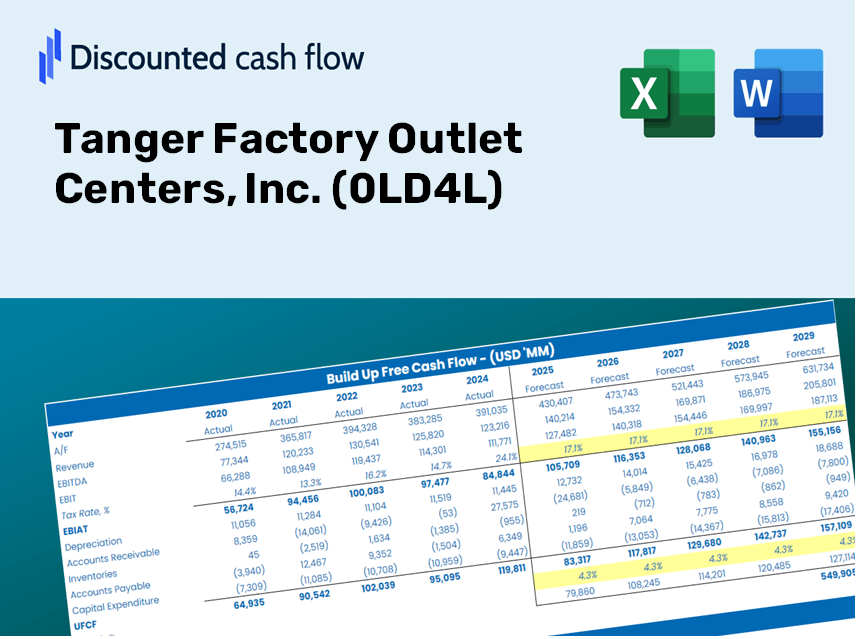
Tanger Factory Outlet Centers, Inc. (0LD4.L) DCF -Bewertung |
Fully Editable: Tailor To Your Needs In Excel Or Sheets
Professional Design: Trusted, Industry-Standard Templates
Investor-Approved Valuation Models
MAC/PC Compatible, Fully Unlocked
No Expertise Is Needed; Easy To Follow
Tanger Inc. (0LD4.L) Bundle
Unser (0LD4L) DCF-Taschenrechner entwickelt für die Genauigkeit und ermöglicht es Ihnen, die Bewertung von Tanger Factory Outlet Centers, Inc. unter Verwendung realer Finanzinformationen und vollständiger Flexibilität zu bewerten, um alle wesentlichen Parameter für erweiterte Projektionen zu ändern.
Discounted Cash Flow (DCF) - (USD MM)
| Year | AY1 2020 |
AY2 2021 |
AY3 2022 |
AY4 2023 |
AY5 2024 |
FY1 2025 |
FY2 2026 |
FY3 2027 |
FY4 2028 |
FY5 2029 |
|---|---|---|---|---|---|---|---|---|---|---|
| Revenue | 393.0 | 430.4 | 442.6 | 472.6 | 526.1 | 566.1 | 609.2 | 655.5 | 705.4 | 759.1 |
| Revenue Growth, % | 0 | 9.5 | 2.85 | 6.79 | 11.3 | 7.61 | 7.61 | 7.61 | 7.61 | 7.61 |
| EBITDA | 208.1 | 223.8 | 227.1 | 242.0 | 289.3 | 297.2 | 319.8 | 344.1 | 370.3 | 398.5 |
| EBITDA, % | 52.96 | 52 | 51.32 | 51.2 | 55 | 52.5 | 52.5 | 52.5 | 52.5 | 52.5 |
| Depreciation | 117.1 | 110.0 | 111.9 | 100.7 | 138.7 | 145.3 | 156.3 | 168.2 | 181.0 | 194.8 |
| Depreciation, % | 29.81 | 25.56 | 25.28 | 21.31 | 26.36 | 25.67 | 25.67 | 25.67 | 25.67 | 25.67 |
| EBIT | 91.0 | 113.8 | 115.2 | 141.3 | 150.6 | 151.9 | 163.4 | 175.9 | 189.3 | 203.7 |
| EBIT, % | 23.15 | 26.44 | 26.04 | 29.89 | 28.63 | 26.83 | 26.83 | 26.83 | 26.83 | 26.83 |
| Total Cash | 84.8 | 161.3 | 264.6 | 15.5 | 47.0 | 148.4 | 159.7 | 171.8 | 184.9 | 198.9 |
| Total Cash, percent | .0 | .0 | .0 | .0 | .0 | .0 | .0 | .0 | .0 | .0 |
| Account Receivables | 65.8 | 53.3 | 51.1 | 48.9 | 57.9 | 70.2 | 75.6 | 81.3 | 87.5 | 94.2 |
| Account Receivables, % | 16.74 | 12.38 | 11.55 | 10.35 | 11.01 | 12.4 | 12.4 | 12.4 | 12.4 | 12.4 |
| Inventories | .0 | -2.5 | -14.1 | .0 | .0 | -4.3 | -4.6 | -4.9 | -5.3 | -5.7 |
| Inventories, % | 0 | -0.57742 | -3.19 | 0 | 0 | -0.75342 | -0.75342 | -0.75342 | -0.75342 | -0.75342 |
| Accounts Payable | 88.3 | 93.0 | 104.7 | 118.5 | 107.8 | 128.3 | 138.0 | 148.5 | 159.8 | 172.0 |
| Accounts Payable, % | 22.46 | 21.61 | 23.66 | 25.07 | 20.49 | 22.66 | 22.66 | 22.66 | 22.66 | 22.66 |
| Capital Expenditure | -28.0 | -45.9 | -47.4 | -10.8 | -108.0 | -58.1 | -62.5 | -67.3 | -72.4 | -77.9 |
| Capital Expenditure, % | -7.13 | -10.67 | -10.7 | -2.28 | -20.54 | -10.26 | -10.26 | -10.26 | -10.26 | -10.26 |
| Tax Rate, % | 4.95 | 4.95 | 4.95 | 4.95 | 4.95 | 4.95 | 4.95 | 4.95 | 4.95 | 4.95 |
| EBITAT | 88.3 | 70.6 | 109.0 | 134.8 | 143.2 | 134.9 | 145.2 | 156.3 | 168.1 | 180.9 |
| Depreciation | ||||||||||
| Changes in Account Receivables | ||||||||||
| Changes in Inventories | ||||||||||
| Changes in Accounts Payable | ||||||||||
| Capital Expenditure | ||||||||||
| UFCF | 199.9 | 154.5 | 199.1 | 226.6 | 154.1 | 234.6 | 243.8 | 262.3 | 282.3 | 303.8 |
| WACC, % | 8.06 | 7.68 | 8.03 | 8.04 | 8.03 | 7.97 | 7.97 | 7.97 | 7.97 | 7.97 |
| PV UFCF | ||||||||||
| SUM PV UFCF | 1,049.6 | |||||||||
| Long Term Growth Rate, % | 2.00 | |||||||||
| Free cash flow (T + 1) | 310 | |||||||||
| Terminal Value | 5,191 | |||||||||
| Present Terminal Value | 3,538 | |||||||||
| Enterprise Value | 4,588 | |||||||||
| Net Debt | 1,480 | |||||||||
| Equity Value | 3,108 | |||||||||
| Diluted Shares Outstanding, MM | 111 | |||||||||
| Equity Value Per Share | 27.98 |
What You Will Receive
- Customizable Excel Template: A tailored Excel-based DCF Calculator featuring pre-populated financial data for Tanger Factory Outlet Centers, Inc. (0LD4L).
- Real Market Data: Access to historical figures and forward-looking projections (highlighted in the yellow cells).
- Flexible Forecasting: Adjust key assumptions such as revenue growth, EBITDA margin, and WACC.
- Instant Calculations: Quickly assess how your inputs affect the valuation of Tanger Factory Outlet Centers, Inc. (0LD4L).
- Professional-Grade Tool: Designed for investors, CFOs, consultants, and financial analysts.
- Intuitive Interface: Organized for simplicity and ease of navigation, complete with step-by-step guidance.
Key Features
- Pre-Loaded Data: Tanger Factory Outlet Centers, Inc.'s historical financial statements and pre-filled forecasts.
- Fully Adjustable Inputs: Modify WACC, tax rates, revenue growth, and EBITDA margins to fit your analysis.
- Instant Results: Observe real-time recalculation of the intrinsic value for Tanger Factory Outlet Centers, Inc. (0LD4L).
- Clear Visual Outputs: Dynamic dashboard charts illustrate valuation outcomes and essential metrics.
- Built for Accuracy: A reliable tool designed for analysts, investors, and finance professionals.
How It Works
- Step 1: Download the prebuilt Excel template featuring Tanger Factory Outlet Centers, Inc. (0LD4L) data.
- Step 2: Navigate through the pre-filled sheets to familiarize yourself with the essential metrics.
- Step 3: Modify the forecasts and assumptions in the editable yellow cells (WACC, growth, margins).
- Step 4: Instantly see the recalculated results, including the intrinsic value of Tanger Factory Outlet Centers, Inc. (0LD4L).
- Step 5: Use the outputs to make informed investment decisions or create reports.
Why Opt for Tanger Factory Outlet Centers, Inc. (0LD4L)?
- Time-Saving: Skip the hassle of building a financial model from the ground up – it's ready for immediate use.
- Enhanced Precision: Utilize dependable financial data and formulas to minimize valuation errors.
- Fully Adjustable: Customize the model to align with your unique assumptions and forecasts.
- User-Friendly: Intuitive charts and outputs ensure the results are straightforward to analyze.
- Preferred by Professionals: Crafted for experts who prioritize accuracy and ease of use.
Who Can Benefit from Tanger Factory Outlet Centers, Inc. (0LD4L)?
- Investors: Gain the confidence to make informed decisions with our high-quality valuation resources.
- Financial Analysts: Streamline your workflow with our ready-to-customize DCF model.
- Consultants: Effortlessly tailor our templates for client presentations and reports.
- Finance Enthusiasts: Enhance your understanding of valuation techniques through practical, real-world examples.
- Educators and Students: Utilize our resources as effective learning tools in finance-centric courses.
Contents of the Template
- Comprehensive DCF Model: An editable template featuring in-depth valuation calculations.
- Real-World Data: Historical and projected financials for Tanger Factory Outlet Centers, Inc. (0LD4L) preloaded for in-depth analysis.
- Customizable Parameters: Modify WACC, growth rates, and tax assumptions to explore various scenarios.
- Financial Statements: Complete annual and quarterly breakdowns for enhanced insights.
- Key Ratios: Integrated analysis focusing on profitability, efficiency, and leverage metrics.
- Dashboard with Visual Outputs: Visualizations including charts and tables for concise, actionable results.
Disclaimer
All information, articles, and product details provided on this website are for general informational and educational purposes only. We do not claim any ownership over, nor do we intend to infringe upon, any trademarks, copyrights, logos, brand names, or other intellectual property mentioned or depicted on this site. Such intellectual property remains the property of its respective owners, and any references here are made solely for identification or informational purposes, without implying any affiliation, endorsement, or partnership.
We make no representations or warranties, express or implied, regarding the accuracy, completeness, or suitability of any content or products presented. Nothing on this website should be construed as legal, tax, investment, financial, medical, or other professional advice. In addition, no part of this site—including articles or product references—constitutes a solicitation, recommendation, endorsement, advertisement, or offer to buy or sell any securities, franchises, or other financial instruments, particularly in jurisdictions where such activity would be unlawful.
All content is of a general nature and may not address the specific circumstances of any individual or entity. It is not a substitute for professional advice or services. Any actions you take based on the information provided here are strictly at your own risk. You accept full responsibility for any decisions or outcomes arising from your use of this website and agree to release us from any liability in connection with your use of, or reliance upon, the content or products found herein.