
|
Galenica AG (0ROG.L) DCF -Bewertung |
Fully Editable: Tailor To Your Needs In Excel Or Sheets
Professional Design: Trusted, Industry-Standard Templates
Investor-Approved Valuation Models
MAC/PC Compatible, Fully Unlocked
No Expertise Is Needed; Easy To Follow
Galenica AG (0ROG.L) Bundle
Unabhängig davon, ob Sie ein Investor oder Analyst sind, ist dieser (0Rogl) DCF-Taschenrechner Ihre Anlaufstelle für eine genaue Bewertung. Mit realen Daten von Galenica AG geladen, können Sie problemlos die Prognosen anpassen und die Effekte in Echtzeit beobachten.
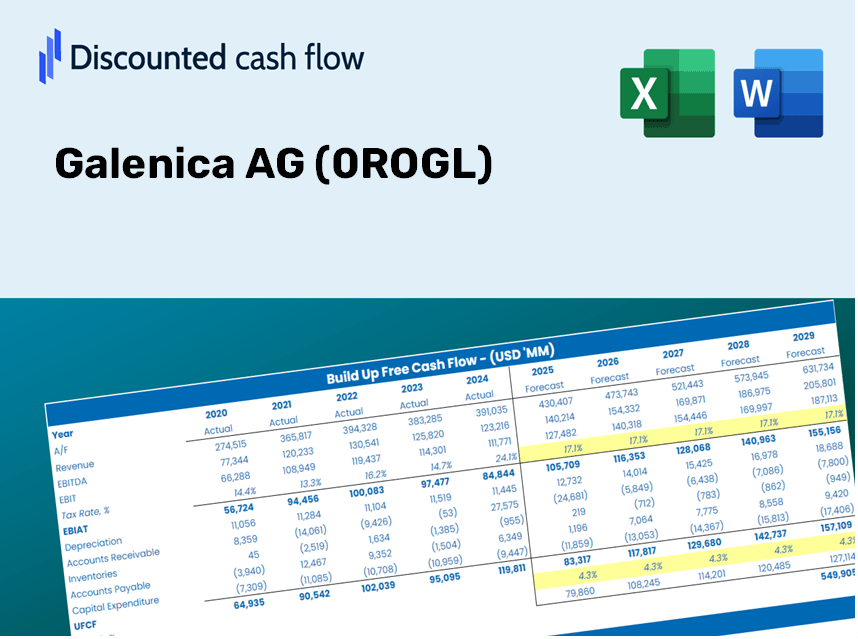
Discounted Cash Flow (DCF) - (USD MM)
| Year | AY1 2020 |
AY2 2021 |
AY3 2022 |
AY4 2023 |
AY5 2024 |
FY1 2025 |
FY2 2026 |
FY3 2027 |
FY4 2028 |
FY5 2029 |
|---|---|---|---|---|---|---|---|---|---|---|
| Revenue | 3,479.8 | 3,834.7 | 4,014.3 | 3,746.0 | 3,921.1 | 4,047.3 | 4,177.5 | 4,312.0 | 4,450.8 | 4,594.0 |
| Revenue Growth, % | 0 | 10.2 | 4.69 | -6.68 | 4.67 | 3.22 | 3.22 | 3.22 | 3.22 | 3.22 |
| EBITDA | 302.8 | 300.3 | 290.5 | 306.9 | 331.3 | 327.1 | 337.6 | 348.5 | 359.7 | 371.3 |
| EBITDA, % | 8.7 | 7.83 | 7.24 | 8.19 | 8.45 | 8.08 | 8.08 | 8.08 | 8.08 | 8.08 |
| Depreciation | 93.4 | 98.4 | 99.6 | 103.0 | 109.8 | 107.5 | 111.0 | 114.5 | 118.2 | 122.0 |
| Depreciation, % | 2.68 | 2.57 | 2.48 | 2.75 | 2.8 | 2.66 | 2.66 | 2.66 | 2.66 | 2.66 |
| EBIT | 209.4 | 201.9 | 190.9 | 203.9 | 221.5 | 219.6 | 226.7 | 234.0 | 241.5 | 249.3 |
| EBIT, % | 6.02 | 5.27 | 4.76 | 5.44 | 5.65 | 5.43 | 5.43 | 5.43 | 5.43 | 5.43 |
| Total Cash | 59.8 | 165.0 | 93.9 | 116.2 | 129.7 | 119.5 | 123.4 | 127.4 | 131.5 | 135.7 |
| Total Cash, percent | .0 | .0 | .0 | .0 | .0 | .0 | .0 | .0 | .0 | .0 |
| Account Receivables | .0 | 503.4 | .0 | 560.3 | 539.0 | 338.6 | 349.5 | 360.8 | 372.4 | 384.4 |
| Account Receivables, % | 0 | 13.13 | 0 | 14.96 | 13.75 | 8.37 | 8.37 | 8.37 | 8.37 | 8.37 |
| Inventories | 306.7 | 295.1 | 315.2 | 357.1 | 363.1 | 349.3 | 360.5 | 372.1 | 384.1 | 396.5 |
| Inventories, % | 8.81 | 7.69 | 7.85 | 9.53 | 9.26 | 8.63 | 8.63 | 8.63 | 8.63 | 8.63 |
| Accounts Payable | 289.6 | 336.2 | 323.3 | 384.8 | 418.3 | 373.0 | 385.0 | 397.4 | 410.2 | 423.4 |
| Accounts Payable, % | 8.32 | 8.77 | 8.05 | 10.27 | 10.67 | 9.22 | 9.22 | 9.22 | 9.22 | 9.22 |
| Capital Expenditure | -55.7 | -60.1 | -70.4 | -76.4 | -72.4 | -71.3 | -73.6 | -75.9 | -78.4 | -80.9 |
| Capital Expenditure, % | -1.6 | -1.57 | -1.75 | -2.04 | -1.85 | -1.76 | -1.76 | -1.76 | -1.76 | -1.76 |
| Tax Rate, % | 14.75 | 14.75 | 14.75 | 14.75 | 14.75 | 14.75 | 14.75 | 14.75 | 14.75 | 14.75 |
| EBITAT | 176.7 | 172.5 | 161.3 | 181.6 | 188.9 | 188.3 | 194.3 | 200.6 | 207.0 | 213.7 |
| Depreciation | ||||||||||
| Changes in Account Receivables | ||||||||||
| Changes in Inventories | ||||||||||
| Changes in Accounts Payable | ||||||||||
| Capital Expenditure | ||||||||||
| UFCF | 197.3 | -234.4 | 661.0 | -332.6 | 275.1 | 393.4 | 221.6 | 228.7 | 236.1 | 243.7 |
| WACC, % | 4.99 | 5 | 4.99 | 5.02 | 4.99 | 5 | 5 | 5 | 5 | 5 |
| PV UFCF | ||||||||||
| SUM PV UFCF | 1,158.5 | |||||||||
| Long Term Growth Rate, % | 2.00 | |||||||||
| Free cash flow (T + 1) | 249 | |||||||||
| Terminal Value | 8,294 | |||||||||
| Present Terminal Value | 6,499 | |||||||||
| Enterprise Value | 7,658 | |||||||||
| Net Debt | 646 | |||||||||
| Equity Value | 7,012 | |||||||||
| Diluted Shares Outstanding, MM | 50 | |||||||||
| Equity Value Per Share | 140.56 |
What You Will Receive
- Authentic Galenica AG Financial Data: Pre-populated with Galenica’s historical and projected figures for accurate analysis.
- Completely Customizable Template: Easily modify essential inputs such as revenue growth, WACC, and EBITDA %.
- Instant Calculations: Witness Galenica’s intrinsic value update in real-time as you make adjustments.
- Professional Valuation Tool: Tailored for investors, analysts, and consultants aiming for precise DCF analyses.
- Intuitive Interface: Designed with a straightforward layout and clear guidelines for users of all skill levels.
Key Features
- Customizable Forecast Inputs: Adjust essential variables such as revenue growth, EBITDA margin, and capital investments.
- Instant DCF Valuation: Automatically computes intrinsic value, NPV, and other key financial metrics.
- High-Precision Accuracy: Leverages Galenica AG’s (0ROGL) actual financial data for realistic valuation results.
- Effortless Scenario Analysis: Easily explore various assumptions and analyze the resulting outcomes.
- Efficiency Booster: Streamline the valuation process by eliminating the need to create complicated models from scratch.
How It Operates
- Download the Template: Gain immediate access to the Excel-based Galenica AG DCF Calculator (0ROGL).
- Input Your Assumptions: Modify the highlighted cells to set your growth rates, WACC, profit margins, and other variables.
- Instant Calculations: The model will automatically refresh to provide Galenica AG's intrinsic value.
- Test Scenarios: Experiment with various inputs to see how they affect potential valuation shifts.
- Analyze and Decide: Utilize the outcomes to inform your investment strategies or financial analyses.
Why Choose This Calculator for Galenica AG (0ROGL)?
- Accurate Data: Utilize genuine Galenica AG financials for trustworthy valuation outcomes.
- Customizable: Tailor essential parameters such as growth rates, WACC, and tax rates to fit your forecasts.
- Time-Saving: Ready-made calculations save you from starting from the ground up.
- Professional-Grade Tool: Crafted for investors, analysts, and consultants focusing on Galenica AG.
- User-Friendly: Accessible design and clear, step-by-step guidance cater to users of all levels.
Who Can Benefit from This Product?
- Investors: Effectively evaluate Galenica AG’s (0ROGL) fair value prior to making investment choices.
- CFOs: Utilize a high-quality DCF model for accurate financial reporting and analysis.
- Consultants: Efficiently customize the template for client valuation reports.
- Entrepreneurs: Discover insights into the financial modeling practices of leading companies.
- Educators: Employ this tool to illustrate various valuation methodologies in the classroom.
What the Template Contains
- Historical Data: Insight into Galenica AG’s previous financial performance and foundational forecasts.
- DCF and Levered DCF Models: Comprehensive templates designed to assess Galenica AG’s intrinsic value.
- WACC Sheet: Ready-made calculations for the Weighted Average Cost of Capital.
- Editable Inputs: Adjust essential parameters such as growth rates, EBITDA %, and CAPEX assumptions.
- Quarterly and Annual Statements: A thorough analysis of Galenica AG’s financials.
- Interactive Dashboard: Dynamically visualize valuation outcomes and forecasts.
Disclaimer
All information, articles, and product details provided on this website are for general informational and educational purposes only. We do not claim any ownership over, nor do we intend to infringe upon, any trademarks, copyrights, logos, brand names, or other intellectual property mentioned or depicted on this site. Such intellectual property remains the property of its respective owners, and any references here are made solely for identification or informational purposes, without implying any affiliation, endorsement, or partnership.
We make no representations or warranties, express or implied, regarding the accuracy, completeness, or suitability of any content or products presented. Nothing on this website should be construed as legal, tax, investment, financial, medical, or other professional advice. In addition, no part of this site—including articles or product references—constitutes a solicitation, recommendation, endorsement, advertisement, or offer to buy or sell any securities, franchises, or other financial instruments, particularly in jurisdictions where such activity would be unlawful.
All content is of a general nature and may not address the specific circumstances of any individual or entity. It is not a substitute for professional advice or services. Any actions you take based on the information provided here are strictly at your own risk. You accept full responsibility for any decisions or outcomes arising from your use of this website and agree to release us from any liability in connection with your use of, or reliance upon, the content or products found herein.