
|
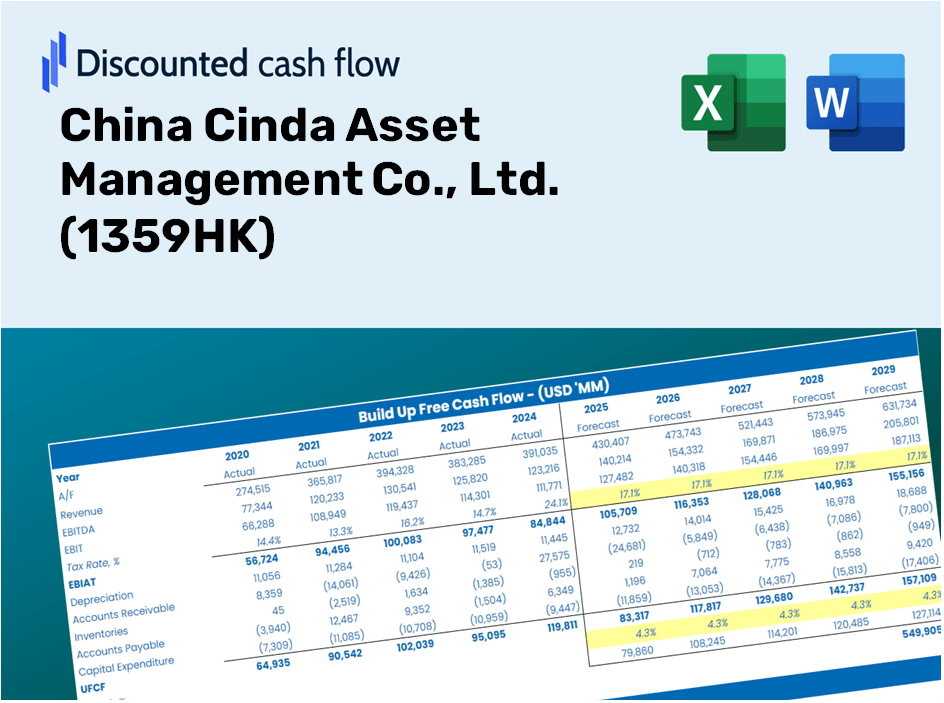
China Cinda Asset Management Co., Ltd. (1359.HK) DCF -Bewertung |
Fully Editable: Tailor To Your Needs In Excel Or Sheets
Professional Design: Trusted, Industry-Standard Templates
Investor-Approved Valuation Models
MAC/PC Compatible, Fully Unlocked
No Expertise Is Needed; Easy To Follow
China Cinda Asset Management Co., Ltd. (1359.HK) Bundle
Treffen Sie mit dem DCF -Taschenrechner (1359HK) fundiertere Investitionsentscheidungen! Erforschen Sie authentische China Cinda Financials, passen Sie die Wachstumsvorhersagen und -kosten an und beobachten Sie sofort, wie sich diese Modifikationen auf den inneren Wert von (1359HK) auswirken.
Discounted Cash Flow (DCF) - (USD MM)
| Year | AY1 2020 |
AY2 2021 |
AY3 2022 |
AY4 2023 |
AY5 2024 |
FY1 2025 |
FY2 2026 |
FY3 2027 |
FY4 2028 |
FY5 2029 |
|---|---|---|---|---|---|---|---|---|---|---|
| Revenue | 53,996.9 | 57,403.1 | 76,463.8 | 27,735.8 | 27,469.8 | 25,741.0 | 24,121.1 | 22,603.1 | 21,180.7 | 19,847.7 |
| Revenue Growth, % | 0 | 6.31 | 33.2 | -63.73 | -0.95905 | -6.29 | -6.29 | -6.29 | -6.29 | -6.29 |
| EBITDA | .0 | 23,393.5 | 13,706.5 | .0 | .0 | 3,020.9 | 2,830.8 | 2,652.6 | 2,485.7 | 2,329.3 |
| EBITDA, % | 0 | 40.75 | 17.93 | 0 | 0 | 11.74 | 11.74 | 11.74 | 11.74 | 11.74 |
| Depreciation | 2,255.3 | 2,204.6 | 2,272.2 | 2,231.0 | 2,397.4 | 1,429.2 | 1,339.2 | 1,254.9 | 1,176.0 | 1,102.0 |
| Depreciation, % | 4.18 | 3.84 | 2.97 | 8.04 | 8.73 | 5.55 | 5.55 | 5.55 | 5.55 | 5.55 |
| EBIT | -2,255.3 | 21,188.9 | 11,434.3 | -2,231.0 | -2,397.4 | 1,591.7 | 1,491.6 | 1,397.7 | 1,309.7 | 1,227.3 |
| EBIT, % | -4.18 | 36.91 | 14.95 | -8.04 | -8.73 | 6.18 | 6.18 | 6.18 | 6.18 | 6.18 |
| Total Cash | 16,811.0 | 19,731.2 | 18,235.0 | 16,660.7 | 162,515.5 | 12,840.8 | 12,032.7 | 11,275.5 | 10,565.9 | 9,901.0 |
| Total Cash, percent | .0 | .0 | .0 | .0 | .0 | .0 | .0 | .0 | .0 | .0 |
| Account Receivables | .0 | 19,871.4 | 21,619.9 | 30,039.6 | 33,241.9 | 13,534.2 | 12,682.5 | 11,884.4 | 11,136.4 | 10,435.6 |
| Account Receivables, % | 0 | 34.62 | 28.27 | 108.31 | 121.01 | 52.58 | 52.58 | 52.58 | 52.58 | 52.58 |
| Inventories | .0 | .0 | .0 | .0 | .0 | .0 | .0 | .0 | .0 | .0 |
| Inventories, % | 0 | 0 | 0 | 0 | 0 | 0 | 0 | 0 | 0 | 0 |
| Accounts Payable | 22,789.8 | 23,980.0 | 27,755.4 | 27,752.0 | 35,757.8 | 16,488.6 | 15,451.0 | 14,478.6 | 13,567.4 | 12,713.6 |
| Accounts Payable, % | 42.21 | 41.77 | 36.3 | 100.06 | 130.17 | 64.06 | 64.06 | 64.06 | 64.06 | 64.06 |
| Capital Expenditure | -5,403.0 | -926.5 | -2,116.8 | -926.4 | -4,310.8 | -1,720.6 | -1,612.3 | -1,510.9 | -1,415.8 | -1,326.7 |
| Capital Expenditure, % | -10.01 | -1.61 | -2.77 | -3.34 | -15.69 | -6.68 | -6.68 | -6.68 | -6.68 | -6.68 |
| Tax Rate, % | 23.91 | 23.91 | 23.91 | 23.91 | 23.91 | 23.91 | 23.91 | 23.91 | 23.91 | 23.91 |
| EBITAT | -1,830.0 | 13,898.5 | 6,903.1 | -1,586.4 | -1,824.3 | 1,127.9 | 1,056.9 | 990.4 | 928.1 | 869.7 |
| Depreciation | ||||||||||
| Changes in Account Receivables | ||||||||||
| Changes in Inventories | ||||||||||
| Changes in Accounts Payable | ||||||||||
| Capital Expenditure | ||||||||||
| UFCF | 17,812.0 | -3,504.5 | 9,085.2 | -8,704.8 | 1,065.8 | 1,274.9 | 597.9 | 560.3 | 525.0 | 492.0 |
| WACC, % | 7.4 | 6.13 | 5.7 | 6.58 | 6.98 | 6.56 | 6.56 | 6.56 | 6.56 | 6.56 |
| PV UFCF | ||||||||||
| SUM PV UFCF | 2,951.5 | |||||||||
| Long Term Growth Rate, % | 2.00 | |||||||||
| Free cash flow (T + 1) | 502 | |||||||||
| Terminal Value | 11,013 | |||||||||
| Present Terminal Value | 8,017 | |||||||||
| Enterprise Value | 10,968 | |||||||||
| Net Debt | -162,515 | |||||||||
| Equity Value | 173,484 | |||||||||
| Diluted Shares Outstanding, MM | 53,897 | |||||||||
| Equity Value Per Share | 3.22 |
What You Will Receive
- Pre-Populated Financial Model: Utilizes China Cinda's historical data for accurate DCF valuations.
- Comprehensive Forecast Management: Modify revenue growth rates, profit margins, WACC, and other critical parameters.
- Real-Time Calculations: Instantaneous updates let you view outcomes as you adjust the inputs.
- Professional-Grade Template: An expertly crafted Excel model tailored for high-quality valuations.
- Flexible and Reusable: Designed for adaptability, enabling multiple uses for thorough forecasts.
Key Features of China Cinda Asset Management Co., Ltd. (1359HK)
- Authentic Financial Data: Gain access to reliable pre-loaded historical figures and future forecasts.
- Adjustable Forecast Parameters: Modify highlighted cells for WACC, growth rates, and margins to suit your analysis.
- Real-Time Calculations: Enjoy automatic updates for DCF, Net Present Value (NPV), and cash flow evaluations.
- User-Friendly Dashboard: Features intuitive charts and summaries for clear visualization of your valuation outcomes.
- Suitable for All Skill Levels: Designed for investors, CFOs, and consultants with an easy-to-navigate layout.
How It Functions
- Step 1: Download the prebuilt Excel template featuring China Cinda Asset Management Co., Ltd.'s data.
- Step 2: Review the pre-filled sheets to familiarize yourself with the essential metrics.
- Step 3: Modify forecasts and assumptions in the editable yellow cells (WACC, growth, margins).
- Step 4: Immediately access the recalculated results, including the intrinsic value of China Cinda Asset Management Co., Ltd. (1359HK).
- Step 5: Use the outputs to make informed investment choices or generate detailed reports.
Why Choose This Calculator for China Cinda Asset Management Co., Ltd. (1359HK)?
- All-in-One Solution: Integrates DCF, WACC, and financial ratio analyses seamlessly.
- Flexible Customization: Modify yellow-highlighted cells to explore different financial scenarios.
- In-Depth Analysis: Automatically computes the intrinsic value and Net Present Value for China Cinda.
- Preloaded Information: Access historical and projected data to establish reliable benchmarks.
- Expert-Level Quality: Perfect for financial analysts, investors, and business consultants working with (1359HK).
Who Should Consider This Product?
- Investors: Evaluate the valuation of China Cinda Asset Management Co., Ltd. (1359HK) before making trading decisions.
- CFOs and Financial Analysts: Optimize valuation methods and assess financial forecasts efficiently.
- Startup Founders: Understand the valuation strategies of leading firms like China Cinda Asset Management Co., Ltd. (1359HK).
- Consultants: Provide comprehensive valuation analyses and reports for your clients.
- Students and Educators: Utilize actual data to learn and teach valuation methodologies.
Contents of the Template
- Pre-Filled Data: Contains historical financial information and projections for China Cinda Asset Management Co., Ltd. (1359HK).
- Discounted Cash Flow Model: An editable DCF valuation model featuring automated calculations.
- Weighted Average Cost of Capital (WACC): A specific sheet designed for WACC calculations based on user-defined inputs.
- Key Financial Ratios: Examine China Cinda's profitability, efficiency, and financial leverage.
- Customizable Inputs: Easily modify revenue growth, profit margins, and tax rates.
- Clear Dashboard: Visual representations and tables that summarize essential valuation outcomes.
Disclaimer
All information, articles, and product details provided on this website are for general informational and educational purposes only. We do not claim any ownership over, nor do we intend to infringe upon, any trademarks, copyrights, logos, brand names, or other intellectual property mentioned or depicted on this site. Such intellectual property remains the property of its respective owners, and any references here are made solely for identification or informational purposes, without implying any affiliation, endorsement, or partnership.
We make no representations or warranties, express or implied, regarding the accuracy, completeness, or suitability of any content or products presented. Nothing on this website should be construed as legal, tax, investment, financial, medical, or other professional advice. In addition, no part of this site—including articles or product references—constitutes a solicitation, recommendation, endorsement, advertisement, or offer to buy or sell any securities, franchises, or other financial instruments, particularly in jurisdictions where such activity would be unlawful.
All content is of a general nature and may not address the specific circumstances of any individual or entity. It is not a substitute for professional advice or services. Any actions you take based on the information provided here are strictly at your own risk. You accept full responsibility for any decisions or outcomes arising from your use of this website and agree to release us from any liability in connection with your use of, or reliance upon, the content or products found herein.