
|
Fuji Oil Holdings Inc. (2607.t) DCF -Bewertung |
Fully Editable: Tailor To Your Needs In Excel Or Sheets
Professional Design: Trusted, Industry-Standard Templates
Investor-Approved Valuation Models
MAC/PC Compatible, Fully Unlocked
No Expertise Is Needed; Easy To Follow
Fuji Oil Holdings Inc. (2607.T) Bundle
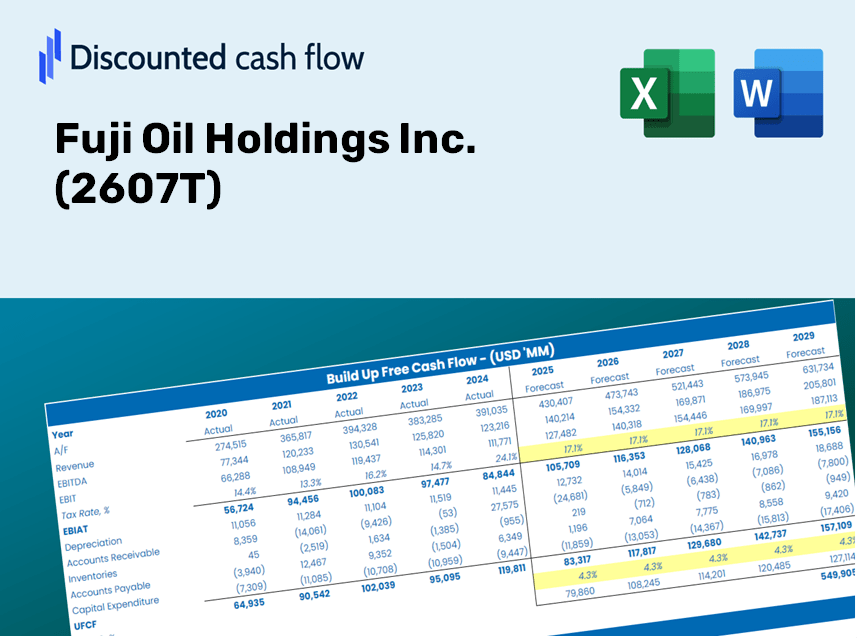
Unabhängig davon, ob Sie ein Investor oder Analyst sind, ist dieser (2607T) DCF -Taschenrechner Ihr wesentliches Werkzeug für eine genaue Bewertung. Ausgestattet mit echten Daten von Fuji Oil Holdings Inc. können Sie Prognosen anpassen und die Auswirkungen in Echtzeit beobachten.
What You Will Receive
- Authentic Fuji Oil Data: Comprehensive financial insights – from revenue to EBIT – derived from actual and forecasted figures.
- Complete Customization: Modify all key parameters (highlighted cells) such as WACC, growth %, and tax rates.
- Immediate Valuation Adjustments: Automatic recalculations to evaluate the effect of modifications on Fuji Oil's fair value.
- Flexible Excel Template: Designed for easy edits, scenario simulations, and in-depth projections.
- Efficient and Precise: Eliminate the need to build models from the ground up while ensuring accuracy and adaptability.
Key Features
- Comprehensive DCF Calculator: Offers detailed unlevered and levered DCF valuation models tailored for Fuji Oil Holdings Inc. (2607T).
- WACC Calculator: Features a pre-built Weighted Average Cost of Capital sheet with customizable input options for enhanced accuracy.
- Adjustable Forecast Assumptions: Easily modify growth rates, capital expenditures, and discount rates to suit your analysis.
- Integrated Financial Ratios: Evaluate profitability, leverage, and efficiency ratios specifically for Fuji Oil Holdings Inc. (2607T).
- Visual Dashboard and Charts: Provides visual representations that summarize essential valuation metrics for straightforward analysis.
How It Functions
- 1. Access the Template: Download and open the Excel file containing Fuji Oil Holdings Inc.'s preloaded data.
- 2. Adjust Assumptions: Modify essential inputs such as growth rates, WACC, and capital expenditures.
- 3. View Results Instantly: The DCF model automatically calculates intrinsic value and NPV in real time.
- 4. Explore Scenarios: Evaluate multiple forecasts to assess various valuation results.
- 5. Utilize with Confidence: Present professional valuation insights to inform your strategic decisions.
Why Opt for This Calculator?
- User-Friendly Interface: Crafted for both novices and seasoned professionals.
- Customizable Inputs: Effortlessly adjust parameters to suit your analytical needs.
- Real-Time Updates: Witness immediate changes in Fuji Oil Holdings Inc.'s (2607T) valuation with every adjustment.
- Preloaded Data: Comes equipped with Fuji Oil's actual financial figures for swift evaluations.
- Valuable Resource: Trusted by investors and analysts for making well-informed decisions.
Who Should Consider Using This Product?
- Professional Investors: Develop accurate valuation models to enhance portfolio assessments for Fuji Oil Holdings Inc. (2607T).
- Corporate Finance Teams: Evaluate valuation scenarios to inform strategic decisions within the organization.
- Consultants and Advisors: Deliver precise valuation insights to clients regarding Fuji Oil Holdings Inc. (2607T).
- Students and Educators: Leverage real-world data to practice and impart financial modeling skills.
- Industry Enthusiasts: Gain insights into how companies like Fuji Oil Holdings Inc. (2607T) are valued in the marketplace.
What the Template Includes
- Comprehensive DCF Model: An editable template featuring in-depth valuation calculations.
- Real-World Data: Fuji Oil Holdings Inc.'s (2607T) historical and projected financials already integrated for analysis.
- Customizable Parameters: Modify WACC, growth rates, and tax assumptions to explore different scenarios.
- Financial Statements: Detailed annual and quarterly breakdowns for enhanced insights.
- Key Ratios: In-built analysis tools for evaluating profitability, efficiency, and leverage.
- Dashboard with Visual Outputs: Graphs and tables that present clear, actionable results.
Disclaimer
All information, articles, and product details provided on this website are for general informational and educational purposes only. We do not claim any ownership over, nor do we intend to infringe upon, any trademarks, copyrights, logos, brand names, or other intellectual property mentioned or depicted on this site. Such intellectual property remains the property of its respective owners, and any references here are made solely for identification or informational purposes, without implying any affiliation, endorsement, or partnership.
We make no representations or warranties, express or implied, regarding the accuracy, completeness, or suitability of any content or products presented. Nothing on this website should be construed as legal, tax, investment, financial, medical, or other professional advice. In addition, no part of this site—including articles or product references—constitutes a solicitation, recommendation, endorsement, advertisement, or offer to buy or sell any securities, franchises, or other financial instruments, particularly in jurisdictions where such activity would be unlawful.
All content is of a general nature and may not address the specific circumstances of any individual or entity. It is not a substitute for professional advice or services. Any actions you take based on the information provided here are strictly at your own risk. You accept full responsibility for any decisions or outcomes arising from your use of this website and agree to release us from any liability in connection with your use of, or reliance upon, the content or products found herein.