
|
JD Logistics, Inc. (2618.HK) DCF -Bewertung |
Fully Editable: Tailor To Your Needs In Excel Or Sheets
Professional Design: Trusted, Industry-Standard Templates
Investor-Approved Valuation Models
MAC/PC Compatible, Fully Unlocked
No Expertise Is Needed; Easy To Follow
JD Logistics, Inc. (2618.HK) Bundle
Stürzen Sie Ihre Analyse und steigern Sie die Präzision mit unserem (2618HK) DCF -Taschenrechner! Dieses Tool ausgestattet mit echten JD -Logistikdaten und anpassbaren Annahmen ermöglicht es Ihnen, JD Logistics, Inc. wie ein erfahrener Investor zu prognostizieren, zu analysieren und zu bewerten.
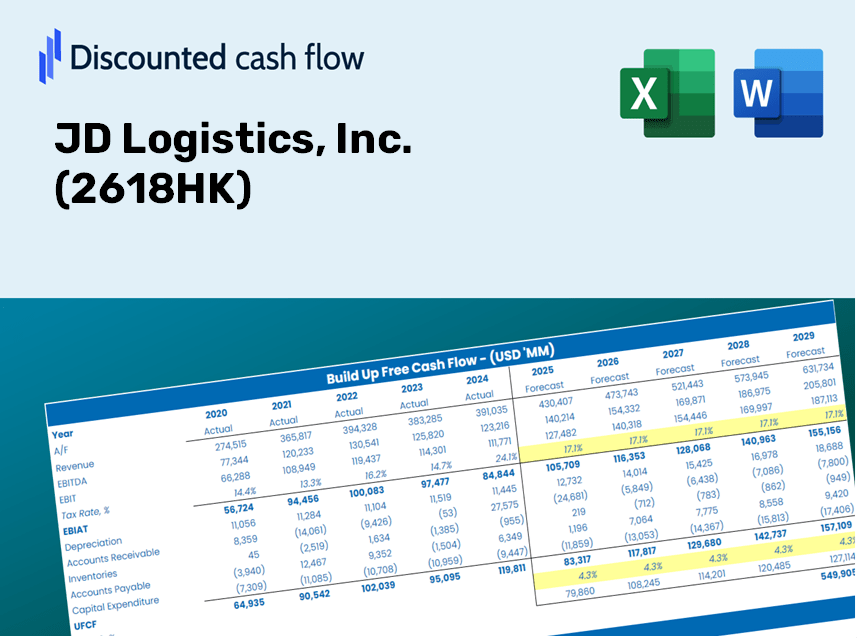
Discounted Cash Flow (DCF) - (USD MM)
| Year | AY1 2020 |
AY2 2021 |
AY3 2022 |
AY4 2023 |
AY5 2024 |
FY1 2025 |
FY2 2026 |
FY3 2027 |
FY4 2028 |
FY5 2029 |
|---|---|---|---|---|---|---|---|---|---|---|
| Revenue | 80,171.7 | 114,391.5 | 150,130.0 | 182,059.7 | 199,774.5 | 224,442.9 | 252,157.5 | 283,294.3 | 318,275.9 | 357,577.0 |
| Revenue Growth, % | 0 | 42.68 | 31.24 | 21.27 | 9.73 | 12.35 | 12.35 | 12.35 | 12.35 | 12.35 |
| EBITDA | 1,737.5 | -7,780.2 | 11,012.3 | 16,361.3 | 12,095.9 | 7,964.4 | 8,947.9 | 10,052.8 | 11,294.1 | 12,688.7 |
| EBITDA, % | 2.17 | -6.8 | 7.34 | 8.99 | 6.05 | 3.55 | 3.55 | 3.55 | 3.55 | 3.55 |
| Depreciation | 5,677.7 | 8,516.6 | 10,944.4 | 13,469.9 | 5,425.2 | 14,333.5 | 16,103.4 | 18,091.9 | 20,325.9 | 22,835.8 |
| Depreciation, % | 7.08 | 7.45 | 7.29 | 7.4 | 2.72 | 6.39 | 6.39 | 6.39 | 6.39 | 6.39 |
| EBIT | -3,940.2 | -16,296.8 | 67.9 | 2,891.4 | 6,670.7 | -6,369.1 | -7,155.5 | -8,039.1 | -9,031.8 | -10,147.1 |
| EBIT, % | -4.91 | -14.25 | 0.0452497 | 1.59 | 3.34 | -2.84 | -2.84 | -2.84 | -2.84 | -2.84 |
| Total Cash | 11,891.5 | 31,592.0 | 38,709.5 | 36,136.4 | 47,140.9 | 50,131.4 | 56,321.7 | 63,276.4 | 71,089.9 | 79,868.2 |
| Total Cash, percent | .0 | .0 | .0 | .0 | .0 | .0 | .0 | .0 | .0 | .0 |
| Account Receivables | 5,932.9 | 13,415.0 | 16,647.8 | 16,446.9 | 17,816.3 | 21,622.2 | 24,292.1 | 27,291.7 | 30,661.8 | 34,447.9 |
| Account Receivables, % | 7.4 | 11.73 | 11.09 | 9.03 | 8.92 | 9.63 | 9.63 | 9.63 | 9.63 | 9.63 |
| Inventories | 429.5 | 746.5 | 707.4 | 682.1 | 705.6 | 1,071.6 | 1,204.0 | 1,352.6 | 1,519.7 | 1,707.3 |
| Inventories, % | 0.53572 | 0.65254 | 0.4712 | 0.37467 | 0.35321 | 0.47747 | 0.47747 | 0.47747 | 0.47747 | 0.47747 |
| Accounts Payable | 6,350.0 | 7,400.1 | 9,942.8 | 9,538.3 | 9,361.8 | 13,887.5 | 15,602.3 | 17,528.9 | 19,693.4 | 22,125.2 |
| Accounts Payable, % | 7.92 | 6.47 | 6.62 | 5.24 | 4.69 | 6.19 | 6.19 | 6.19 | 6.19 | 6.19 |
| Capital Expenditure | -3,521.5 | -4,633.4 | -5,469.4 | -5,988.7 | -6,139.4 | -8,281.3 | -9,303.9 | -10,452.8 | -11,743.5 | -13,193.6 |
| Capital Expenditure, % | -4.39 | -4.05 | -3.64 | -3.29 | -3.07 | -3.69 | -3.69 | -3.69 | -3.69 | -3.69 |
| Tax Rate, % | 19.68 | 19.68 | 19.68 | 19.68 | 19.68 | 19.68 | 19.68 | 19.68 | 19.68 | 19.68 |
| EBITAT | -4,022.6 | -16,549.2 | 116.5 | 1,100.5 | 5,358.2 | -5,329.5 | -5,987.6 | -6,726.9 | -7,557.6 | -8,490.8 |
| Depreciation | ||||||||||
| Changes in Account Receivables | ||||||||||
| Changes in Inventories | ||||||||||
| Changes in Accounts Payable | ||||||||||
| Capital Expenditure | ||||||||||
| UFCF | -1,878.8 | -19,415.0 | 4,940.5 | 8,403.4 | 3,074.7 | 1,076.5 | -275.5 | -309.5 | -347.7 | -390.7 |
| WACC, % | 6.86 | 6.86 | 6.86 | 6.19 | 6.65 | 6.69 | 6.69 | 6.69 | 6.69 | 6.69 |
| PV UFCF | ||||||||||
| SUM PV UFCF | -39.0 | |||||||||
| Long Term Growth Rate, % | 3.50 | |||||||||
| Free cash flow (T + 1) | -404 | |||||||||
| Terminal Value | -12,694 | |||||||||
| Present Terminal Value | -9,185 | |||||||||
| Enterprise Value | -9,224 | |||||||||
| Net Debt | -2,887 | |||||||||
| Equity Value | -6,338 | |||||||||
| Diluted Shares Outstanding, MM | 6,342 | |||||||||
| Equity Value Per Share | -1.00 |
What You Will Receive
- Pre-Filled Financial Model: JD Logistics’ actual data facilitates an accurate DCF valuation.
- Comprehensive Forecast Control: Modify revenue growth, profit margins, WACC, and other essential drivers.
- Real-Time Calculations: Automatic updates ensure immediate visibility of results as you implement changes.
- Investor-Ready Template: A polished Excel file crafted for professional-level valuation.
- Customizable and Reusable: Designed for adaptability, allowing repeated application for in-depth forecasts.
Key Features
- Comprehensive JD Logistics Financials: Access reliable historical data and future forecasts tailored for [2618HK].
- Flexible Forecast Assumptions: Modify highlighted cells to adjust parameters such as WACC, growth rates, and profit margins.
- Real-Time Calculations: Automatic updates for DCF, Net Present Value (NPV), and cash flow analysis are provided.
- User-Friendly Dashboard: Clear charts and summaries to help you easily interpret your valuation outcomes.
- Suitable for All Skill Levels: An intuitive design created for investors, CFOs, and consultants alike.
How It Works
- Step 1: Download the prebuilt Excel template featuring JD Logistics, Inc.’s (2618HK) data.
- Step 2: Navigate through the pre-filled sheets to grasp the essential metrics.
- Step 3: Modify forecasts and assumptions in the editable yellow cells (WACC, growth, margins).
- Step 4: Instantly view the recalculated results, including the intrinsic value of JD Logistics, Inc. (2618HK).
- Step 5: Make informed investment decisions or create reports based on the outputs.
Why Opt for This Calculator?
- Designed for Experts: A sophisticated tool favored by analysts, CFOs, and consultants.
- Accurate Data: JD Logistics' historical and projected financials preloaded for precision.
- Scenario Analysis: Easily test various forecasts and assumptions.
- Clear Results: Automatically provides intrinsic value, NPV, and essential metrics.
- User-Friendly: Step-by-step guidance makes the process straightforward.
Who Can Benefit from JD Logistics, Inc. (2618HK)?
- Investors: Evaluate JD Logistics’ financial health before making stock transactions.
- CFOs and Financial Analysts: Enhance valuation methods and analyze future projections.
- Startup Founders: Gain insights into how leading logistics firms like JD Logistics are appraised.
- Consultants: Create comprehensive valuation reports for client consultations.
- Students and Educators: Utilize real-life data to practice and instruct on valuation methodologies.
What the Template Includes
- Preloaded JD Logistics Data: Historical and forecasted financial metrics, encompassing revenue, EBIT, and capital expenditures.
- DCF and WACC Models: Advanced spreadsheets designed for calculating intrinsic value and Weighted Average Cost of Capital.
- Editable Inputs: Cells highlighted in yellow for modifying revenue growth, tax rates, and discount rates.
- Financial Statements: Detailed annual and quarterly financial reports for in-depth analysis.
- Key Ratios: Metrics on profitability, leverage, and efficiency to assess company performance.
- Dashboard and Charts: Visual representations of valuation results and underlying assumptions.
Disclaimer
All information, articles, and product details provided on this website are for general informational and educational purposes only. We do not claim any ownership over, nor do we intend to infringe upon, any trademarks, copyrights, logos, brand names, or other intellectual property mentioned or depicted on this site. Such intellectual property remains the property of its respective owners, and any references here are made solely for identification or informational purposes, without implying any affiliation, endorsement, or partnership.
We make no representations or warranties, express or implied, regarding the accuracy, completeness, or suitability of any content or products presented. Nothing on this website should be construed as legal, tax, investment, financial, medical, or other professional advice. In addition, no part of this site—including articles or product references—constitutes a solicitation, recommendation, endorsement, advertisement, or offer to buy or sell any securities, franchises, or other financial instruments, particularly in jurisdictions where such activity would be unlawful.
All content is of a general nature and may not address the specific circumstances of any individual or entity. It is not a substitute for professional advice or services. Any actions you take based on the information provided here are strictly at your own risk. You accept full responsibility for any decisions or outcomes arising from your use of this website and agree to release us from any liability in connection with your use of, or reliance upon, the content or products found herein.