
|
Aeon Reit Investment Corporation (3292.t) DCF -Bewertung |
Fully Editable: Tailor To Your Needs In Excel Or Sheets
Professional Design: Trusted, Industry-Standard Templates
Investor-Approved Valuation Models
MAC/PC Compatible, Fully Unlocked
No Expertise Is Needed; Easy To Follow
AEON REIT Investment Corporation (3292.T) Bundle
Bewerten Sie die finanziellen Aussichten der Aeon Reit Investment Corporation wie ein Experte! Dieser (3292T) DCF-Taschenrechner bietet Ihnen vorgefüllte Finanzdaten und die Flexibilität, das Umsatzwachstum, WACC, Margen und andere wesentliche Annahmen zu ändern, um sich mit Ihren Vorhersagen auszurichten.
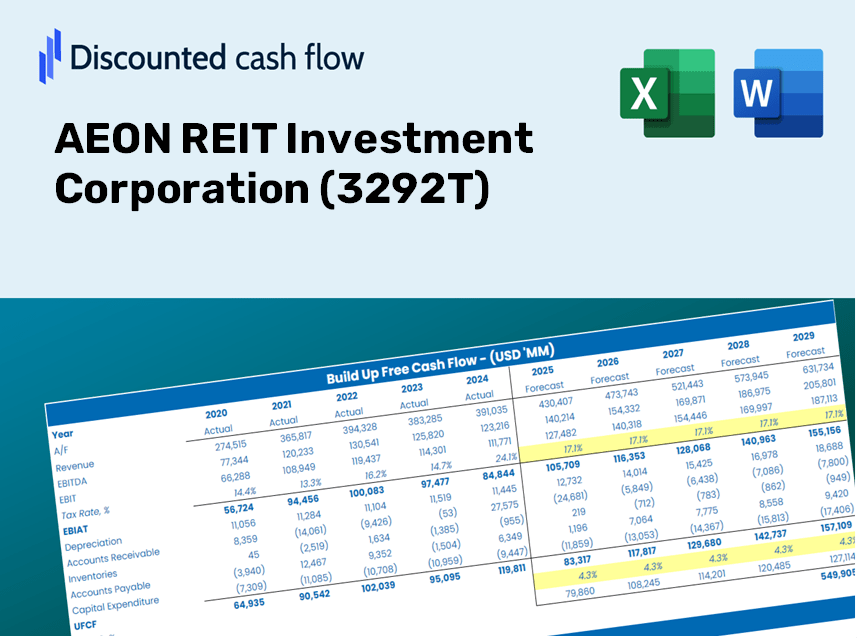
Discounted Cash Flow (DCF) - (USD MM)
| Year | AY1 2020 |
AY2 2021 |
AY3 2022 |
AY4 2023 |
AY5 2024 |
FY1 2025 |
FY2 2026 |
FY3 2027 |
FY4 2028 |
FY5 2029 |
|---|---|---|---|---|---|---|---|---|---|---|
| Revenue | 35,398.1 | 40,050.4 | 40,995.8 | 42,216.2 | 42,352.1 | 44,342.9 | 46,427.3 | 48,609.6 | 50,894.5 | 53,286.8 |
| Revenue Growth, % | 0 | 13.14 | 2.36 | 2.98 | 0.32206 | 4.7 | 4.7 | 4.7 | 4.7 | 4.7 |
| EBITDA | 22,443.4 | 25,295.0 | 25,892.8 | 25,884.4 | 26,403.8 | 27,792.1 | 29,098.5 | 30,466.3 | 31,898.4 | 33,397.8 |
| EBITDA, % | 63.4 | 63.16 | 63.16 | 61.31 | 62.34 | 62.68 | 62.68 | 62.68 | 62.68 | 62.68 |
| Depreciation | 9,363.9 | 10,394.8 | 10,670.3 | 10,703.5 | 10,679.9 | 11,441.0 | 11,978.8 | 12,541.9 | 13,131.4 | 13,748.6 |
| Depreciation, % | 26.45 | 25.95 | 26.03 | 25.35 | 25.22 | 25.8 | 25.8 | 25.8 | 25.8 | 25.8 |
| EBIT | 13,079.5 | 14,900.2 | 15,222.5 | 15,180.9 | 15,723.8 | 16,351.1 | 17,119.7 | 17,924.4 | 18,767.0 | 19,649.1 |
| EBIT, % | 36.95 | 37.2 | 37.13 | 35.96 | 37.13 | 36.87 | 36.87 | 36.87 | 36.87 | 36.87 |
| Total Cash | 18,185.8 | 21,399.3 | 23,939.5 | 31,350.0 | 26,930.2 | 26,698.7 | 27,953.7 | 29,267.6 | 30,643.4 | 32,083.8 |
| Total Cash, percent | .0 | .0 | .0 | .0 | .0 | .0 | .0 | .0 | .0 | .0 |
| Account Receivables | .0 | .0 | 728.2 | 32.0 | .0 | 164.3 | 172.0 | 180.1 | 188.6 | 197.4 |
| Account Receivables, % | 0.000050850148 | 0.000044943417 | 1.78 | 0.07590219 | 0 | 0.37048 | 0.37048 | 0.37048 | 0.37048 | 0.37048 |
| Inventories | 8,864.8 | 9,351.2 | 9,622.8 | .0 | .0 | 6,373.4 | 6,672.9 | 6,986.6 | 7,315.0 | 7,658.8 |
| Inventories, % | 25.04 | 23.35 | 23.47 | 0 | 0 | 14.37 | 14.37 | 14.37 | 14.37 | 14.37 |
| Accounts Payable | 333.3 | 1,866.2 | 1,009.1 | 7,483.1 | 1,832.5 | 2,670.8 | 2,796.3 | 2,927.8 | 3,065.4 | 3,209.5 |
| Accounts Payable, % | 0.94152 | 4.66 | 2.46 | 17.73 | 4.33 | 6.02 | 6.02 | 6.02 | 6.02 | 6.02 |
| Capital Expenditure | -8,560.9 | -53,872.9 | -25,628.4 | -4,060.0 | .0 | -17,410.5 | -18,228.9 | -19,085.7 | -19,982.9 | -20,922.2 |
| Capital Expenditure, % | -24.18 | -134.51 | -62.51 | -9.62 | 0 | -39.26 | -39.26 | -39.26 | -39.26 | -39.26 |
| Tax Rate, % | 0.00898949 | 0.00898949 | 0.00898949 | 0.00898949 | 0.00898949 | 0.00898949 | 0.00898949 | 0.00898949 | 0.00898949 | 0.00898949 |
| EBITAT | 13,078.2 | 14,898.9 | 15,221.1 | 15,179.5 | 15,722.4 | 16,349.6 | 17,118.2 | 17,922.8 | 18,765.3 | 19,647.3 |
| Depreciation | ||||||||||
| Changes in Account Receivables | ||||||||||
| Changes in Inventories | ||||||||||
| Changes in Accounts Payable | ||||||||||
| Capital Expenditure | ||||||||||
| UFCF | 5,349.6 | -27,532.7 | -1,593.9 | 38,616.0 | 20,783.8 | 4,680.8 | 10,686.3 | 11,188.6 | 11,714.5 | 12,265.2 |
| WACC, % | 4.15 | 4.15 | 4.15 | 4.15 | 4.15 | 4.15 | 4.15 | 4.15 | 4.15 | 4.15 |
| PV UFCF | ||||||||||
| SUM PV UFCF | 44,213.9 | |||||||||
| Long Term Growth Rate, % | 2.00 | |||||||||
| Free cash flow (T + 1) | 12,510 | |||||||||
| Terminal Value | 581,770 | |||||||||
| Present Terminal Value | 474,729 | |||||||||
| Enterprise Value | 518,943 | |||||||||
| Net Debt | 161,470 | |||||||||
| Equity Value | 357,473 | |||||||||
| Diluted Shares Outstanding, MM | 2 | |||||||||
| Equity Value Per Share | 168,990.50 |
What You Will Receive
- Customizable Excel Template: A complete Excel-based DCF Calculator featuring pre-populated financial information for AEON REIT Investment Corporation (3292T).
- Comprehensive Data: Access to historical performance data and future estimates (highlighted in the yellow cells).
- Flexible Forecasting: Adjust key assumptions such as revenue growth, EBITDA margin, and WACC.
- Instant Calculations: Quickly observe how your input variables affect the valuation of AEON REIT Investment Corporation (3292T).
- Professional Resource: Designed for use by investors, CFOs, consultants, and financial analysts.
- Intuitive Interface: Organized for straightforward navigation and usability, complete with detailed instructions.
Key Features
- Customizable Investment Parameters: Adjust essential variables such as rental income growth, occupancy rates, and capital expenditures.
- Instant DCF Valuation: Quickly computes intrinsic value, NPV, and other financial metrics.
- High Precision Accuracy: Leverages AEON REIT's actual financial data for credible valuation results.
- Simplified Scenario Analysis: Effortlessly evaluate various assumptions and analyze outcomes.
- Efficiency Booster: Removes the need for constructing intricate valuation models from the ground up.
How It Works
- Step 1: Download the Excel file for AEON REIT Investment Corporation (3292T).
- Step 2: Review the pre-filled financial data and forecasts for AEON REIT.
- Step 3: Adjust key inputs such as revenue growth, WACC, and tax rates (highlighted cells).
- Step 4: Observe the DCF model update in real-time as you modify your assumptions.
- Step 5: Analyze the results and leverage them for your investment strategies.
Why Opt for This Calculator?
- User-Friendly Design: Tailored for both novices and seasoned professionals.
- Customizable Inputs: Modify assumptions easily to suit your financial analysis.
- Real-Time Feedback: Witness immediate updates to AEON REIT Investment Corporation’s valuation as you adjust variables.
- Preloaded Data: Comes equipped with AEON REIT’s current financial statistics for swift evaluations.
- Preferred by Experts: Utilized by investors and analysts for well-informed decision-making.
Who Can Benefit from This Product?
- Investors: Assess AEON REIT Investment Corporation’s (3292T) valuation prior to making stock transactions.
- CFOs and Financial Analysts: Enhance valuation workflows and validate financial projections.
- Startup Founders: Discover the valuation methods employed for significant public entities like AEON REIT (3292T).
- Consultants: Create comprehensive valuation reports for your clients using AEON REIT (3292T) data.
- Students and Educators: Utilize real-world examples to learn and teach valuation strategies with AEON REIT (3292T).
Contents of the Template
- Pre-Populated Data: Contains AEON REIT Investment Corporation's historical financial information and projections.
- Discounted Cash Flow Model: An editable DCF valuation model featuring automatic calculations.
- Weighted Average Cost of Capital (WACC): A dedicated worksheet for WACC calculations based on user-defined inputs.
- Essential Financial Ratios: Evaluate AEON REIT's profitability, efficiency, and financial leverage.
- Flexible Inputs: Easily adjust revenue growth, profit margins, and tax rates.
- User-Friendly Dashboard: Visual representations including charts and tables highlighting key valuation outcomes.
Disclaimer
All information, articles, and product details provided on this website are for general informational and educational purposes only. We do not claim any ownership over, nor do we intend to infringe upon, any trademarks, copyrights, logos, brand names, or other intellectual property mentioned or depicted on this site. Such intellectual property remains the property of its respective owners, and any references here are made solely for identification or informational purposes, without implying any affiliation, endorsement, or partnership.
We make no representations or warranties, express or implied, regarding the accuracy, completeness, or suitability of any content or products presented. Nothing on this website should be construed as legal, tax, investment, financial, medical, or other professional advice. In addition, no part of this site—including articles or product references—constitutes a solicitation, recommendation, endorsement, advertisement, or offer to buy or sell any securities, franchises, or other financial instruments, particularly in jurisdictions where such activity would be unlawful.
All content is of a general nature and may not address the specific circumstances of any individual or entity. It is not a substitute for professional advice or services. Any actions you take based on the information provided here are strictly at your own risk. You accept full responsibility for any decisions or outcomes arising from your use of this website and agree to release us from any liability in connection with your use of, or reliance upon, the content or products found herein.