
|
Information Services International-Dentsu, Ltd. (4812.t) DCF-Bewertung |
Fully Editable: Tailor To Your Needs In Excel Or Sheets
Professional Design: Trusted, Industry-Standard Templates
Investor-Approved Valuation Models
MAC/PC Compatible, Fully Unlocked
No Expertise Is Needed; Easy To Follow
Information Services International-Dentsu, Ltd. (4812.T) Bundle
Entdecken Sie den wahren Wert von Information Services International-Dentsu, Ltd. (4812t) mit unserem erweiterten DCF-Taschenrechner! Passen Sie wesentliche Annahmen an, erkunden Sie verschiedene Szenarien und bewerten Sie, wie unterschiedliche Faktoren die Bewertung von International-Dentsu, Ltd. (4812T) in Information Services beeinflussen-alles innerhalb einer umfassenden Excel-Vorlage.
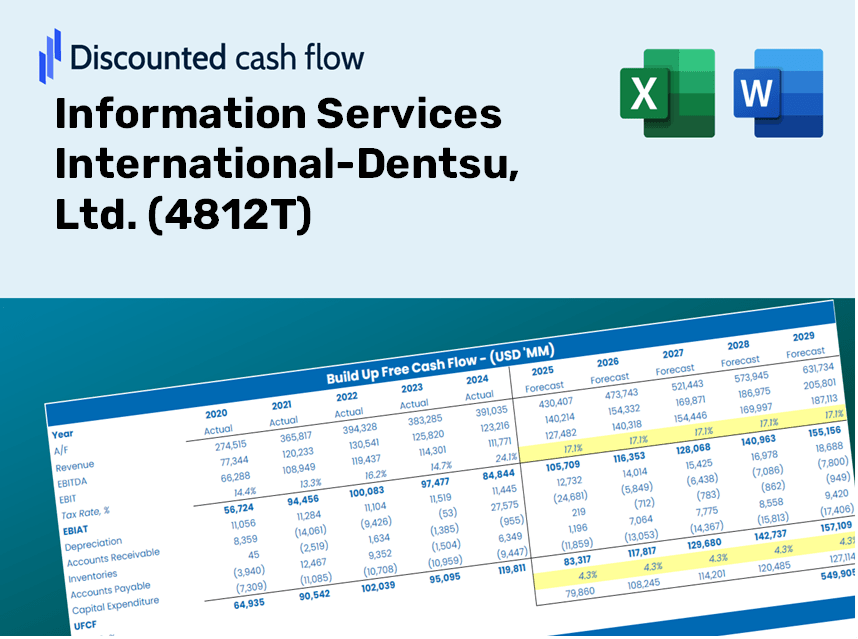
Discounted Cash Flow (DCF) - (USD MM)
| Year | AY1 2020 |
AY2 2021 |
AY3 2022 |
AY4 2023 |
AY5 2024 |
FY1 2025 |
FY2 2026 |
FY3 2027 |
FY4 2028 |
FY5 2029 |
|---|---|---|---|---|---|---|---|---|---|---|
| Revenue | 108,679.0 | 112,085.0 | 129,054.0 | 142,608.0 | 152,642.0 | 166,308.1 | 181,197.6 | 197,420.3 | 215,095.4 | 234,352.9 |
| Revenue Growth, % | 0 | 3.13 | 15.14 | 10.5 | 7.04 | 8.95 | 8.95 | 8.95 | 8.95 | 8.95 |
| EBITDA | 13,854.0 | 16,194.0 | 20,776.0 | 24,179.0 | 25,209.0 | 25,533.0 | 27,819.0 | 30,309.6 | 33,023.3 | 35,979.9 |
| EBITDA, % | 12.75 | 14.45 | 16.1 | 16.95 | 16.52 | 15.35 | 15.35 | 15.35 | 15.35 | 15.35 |
| Depreciation | 2,865.0 | 2,989.0 | 3,103.0 | 3,200.0 | 3,820.0 | 4,142.4 | 4,513.2 | 4,917.3 | 5,357.5 | 5,837.2 |
| Depreciation, % | 2.64 | 2.67 | 2.4 | 2.24 | 2.5 | 2.49 | 2.49 | 2.49 | 2.49 | 2.49 |
| EBIT | 10,989.0 | 13,205.0 | 17,673.0 | 20,979.0 | 21,389.0 | 21,390.7 | 23,305.8 | 25,392.4 | 27,665.7 | 30,142.7 |
| EBIT, % | 10.11 | 11.78 | 13.69 | 14.71 | 14.01 | 12.86 | 12.86 | 12.86 | 12.86 | 12.86 |
| Total Cash | 40,038.0 | 50,154.0 | 53,755.0 | 58,032.0 | 62,315.0 | 68,105.7 | 74,203.2 | 80,846.7 | 88,084.9 | 95,971.1 |
| Total Cash, percent | .0 | .0 | .0 | .0 | .0 | .0 | .0 | .0 | .0 | .0 |
| Account Receivables | 24,525.0 | 23,236.0 | 30,374.0 | 35,433.0 | 33,560.0 | 37,807.0 | 41,191.9 | 44,879.8 | 48,897.9 | 53,275.7 |
| Account Receivables, % | 22.57 | 20.73 | 23.54 | 24.85 | 21.99 | 22.73 | 22.73 | 22.73 | 22.73 | 22.73 |
| Inventories | 1,913.0 | 1,365.0 | 150.0 | 77.0 | 120.0 | 1,073.3 | 1,169.4 | 1,274.1 | 1,388.2 | 1,512.5 |
| Inventories, % | 1.76 | 1.22 | 0.11623 | 0.05399417 | 0.07861532 | 0.64538 | 0.64538 | 0.64538 | 0.64538 | 0.64538 |
| Accounts Payable | 7,778.0 | 9,606.0 | 14,163.0 | 14,358.0 | 15,083.0 | 15,516.9 | 16,906.1 | 18,419.7 | 20,068.9 | 21,865.6 |
| Accounts Payable, % | 7.16 | 8.57 | 10.97 | 10.07 | 9.88 | 9.33 | 9.33 | 9.33 | 9.33 | 9.33 |
| Capital Expenditure | -1,888.0 | -2,439.0 | -2,888.0 | -2,378.0 | -333.0 | -2,673.1 | -2,912.5 | -3,173.2 | -3,457.3 | -3,766.9 |
| Capital Expenditure, % | -1.74 | -2.18 | -2.24 | -1.67 | -0.21816 | -1.61 | -1.61 | -1.61 | -1.61 | -1.61 |
| Tax Rate, % | 29.2 | 29.2 | 29.2 | 29.2 | 29.2 | 29.2 | 29.2 | 29.2 | 29.2 | 29.2 |
| EBITAT | 7,388.2 | 8,967.1 | 12,613.7 | 14,682.6 | 15,143.9 | 14,858.0 | 16,188.3 | 17,637.6 | 19,216.7 | 20,937.2 |
| Depreciation | ||||||||||
| Changes in Account Receivables | ||||||||||
| Changes in Inventories | ||||||||||
| Changes in Accounts Payable | ||||||||||
| Capital Expenditure | ||||||||||
| UFCF | -10,294.8 | 13,182.1 | 11,462.7 | 10,713.6 | 21,185.9 | 11,560.8 | 15,697.3 | 17,102.7 | 18,633.9 | 20,302.2 |
| WACC, % | 4.61 | 4.61 | 4.61 | 4.61 | 4.61 | 4.61 | 4.61 | 4.61 | 4.61 | 4.61 |
| PV UFCF | ||||||||||
| SUM PV UFCF | 72,103.0 | |||||||||
| Long Term Growth Rate, % | 3.00 | |||||||||
| Free cash flow (T + 1) | 20,911 | |||||||||
| Terminal Value | 1,299,403 | |||||||||
| Present Terminal Value | 1,037,272 | |||||||||
| Enterprise Value | 1,109,375 | |||||||||
| Net Debt | -4,398 | |||||||||
| Equity Value | 1,113,773 | |||||||||
| Diluted Shares Outstanding, MM | 65 | |||||||||
| Equity Value Per Share | 17,115.48 |
Benefits of Our Offering
- Adjustable Forecast Parameters: Modify key assumptions (growth %, margins, WACC) effortlessly to explore various scenarios.
- Industry-Specific Data: Pre-loaded financial information for Information Services International-Dentsu, Ltd. (4812T) to facilitate your analysis.
- Instant DCF Calculations: The template automatically computes the Net Present Value (NPV) and intrinsic value for you.
- Customizable and Professional Design: A refined Excel model that caters to your specific valuation requirements.
- Engineered for Analysts and Investors: Perfect for examining projections, validating strategies, and increasing efficiency.
Key Features
- Pre-Loaded Data: Historical financial statements and pre-filled forecasts for Information Services International-Dentsu, Ltd. (4812T).
- Fully Adjustable Inputs: Customize WACC, tax rates, revenue growth, and EBITDA margins.
- Instant Results: Watch as the intrinsic value of Information Services International-Dentsu, Ltd. (4812T) recalculates in real time.
- Clear Visual Outputs: Dashboard charts provide a visual representation of valuation results and key metrics.
- Built for Accuracy: A professional tool designed for analysts, investors, and finance experts.
How It Functions
- Step 1: Download the Excel spreadsheet.
- Step 2: Examine the pre-filled financial data and projections for Information Services International-Dentsu, Ltd. (4812T).
- Step 3: Adjust key inputs such as revenue growth, WACC, and tax rates (highlighted cells).
- Step 4: Observe the DCF model refresh in real-time as you modify your assumptions.
- Step 5: Evaluate the outcomes and leverage the findings for your investment strategies.
Why Opt for This Calculator?
- Save Valuable Time: Instantly access a ready-to-use DCF model without the hassle of building one from scratch.
- Enhance Precision: Reliable financial data and consistent formulas minimize valuation errors.
- Completely Customizable: Adapt the model to align with your specific assumptions and forecasts.
- Simple to Understand: Intuitive charts and outputs simplify result analysis.
- Endorsed by Professionals: Crafted for experts who prioritize accuracy and user-friendliness.
Who Can Benefit from This Product?
- Investors: Evaluate the valuation of Information Services International-Dentsu, Ltd. (4812T) before making investment decisions.
- Chief Financial Officers and Financial Analysts: Optimize valuation workflows and validate financial forecasts.
- Startup Founders: Gain insights into how large public companies like Information Services International-Dentsu, Ltd. (4812T) establish their valuations.
- Consultants: Create comprehensive valuation reports tailored for your clients' needs.
- Students and Educators: Utilize real-time data to practice and impart valuation methodologies.
Contents of the Template
- Operating and Balance Sheet Data: Pre-filled historical data and forecasts for Information Services International-Dentsu, Ltd. (4812T), including revenue, EBITDA, EBIT, and capital expenditures.
- WACC Calculation: A dedicated sheet for calculating the Weighted Average Cost of Capital (WACC), featuring parameters such as Beta, risk-free rate, and share price.
- DCF Valuation (Unlevered and Levered): Customizable Discounted Cash Flow models displaying intrinsic value along with comprehensive calculations.
- Financial Statements: Pre-loaded annual and quarterly financial statements to facilitate thorough analysis.
- Key Ratios: A collection of profitability, leverage, and efficiency ratios specifically for Information Services International-Dentsu, Ltd. (4812T).
- Dashboard and Charts: A visual summary of valuation outputs and underlying assumptions for easier result analysis.
Disclaimer
All information, articles, and product details provided on this website are for general informational and educational purposes only. We do not claim any ownership over, nor do we intend to infringe upon, any trademarks, copyrights, logos, brand names, or other intellectual property mentioned or depicted on this site. Such intellectual property remains the property of its respective owners, and any references here are made solely for identification or informational purposes, without implying any affiliation, endorsement, or partnership.
We make no representations or warranties, express or implied, regarding the accuracy, completeness, or suitability of any content or products presented. Nothing on this website should be construed as legal, tax, investment, financial, medical, or other professional advice. In addition, no part of this site—including articles or product references—constitutes a solicitation, recommendation, endorsement, advertisement, or offer to buy or sell any securities, franchises, or other financial instruments, particularly in jurisdictions where such activity would be unlawful.
All content is of a general nature and may not address the specific circumstances of any individual or entity. It is not a substitute for professional advice or services. Any actions you take based on the information provided here are strictly at your own risk. You accept full responsibility for any decisions or outcomes arising from your use of this website and agree to release us from any liability in connection with your use of, or reliance upon, the content or products found herein.