
|
Innere Mongolei Yili Industrial Group Co., Ltd. (600887.SS) DCF -Bewertung |
Fully Editable: Tailor To Your Needs In Excel Or Sheets
Professional Design: Trusted, Industry-Standard Templates
Investor-Approved Valuation Models
MAC/PC Compatible, Fully Unlocked
No Expertise Is Needed; Easy To Follow
Inner Mongolia Yili Industrial Group Co., Ltd. (600887.SS) Bundle
Optimieren Sie Ihre Zeit und verbessern Sie die Präzision mit unserem DCF -Taschenrechner (600887)! Die Verwendung realer Daten aus der inneren Mongolei Yili Industrial Group Co., Ltd. und anpassbaren Annahmen ermöglicht es Ihnen, Ihnen zu prognostizieren, zu analysieren und zu bewerten (600887SS), als ob Sie ein erfahrener Investor waren.
What You Will Receive
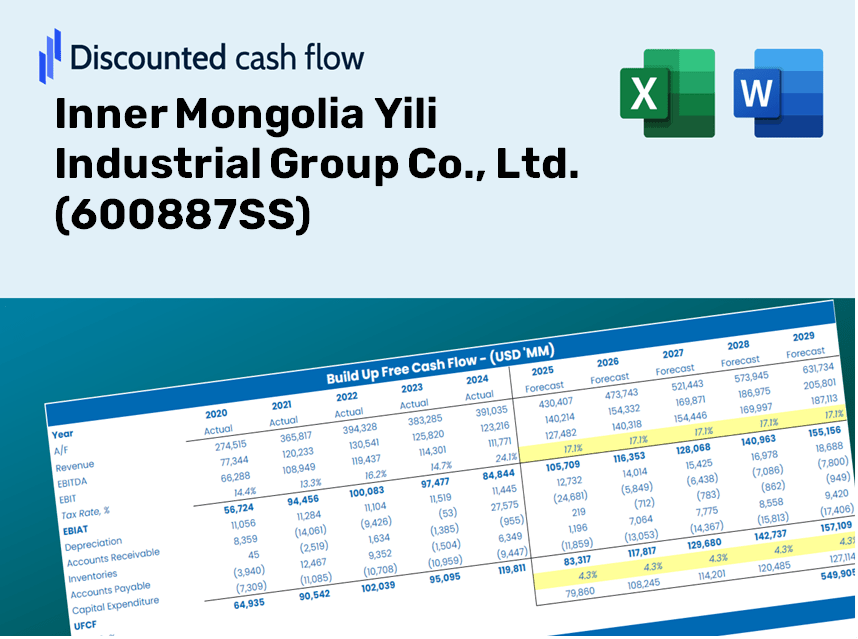
- Genuine YILI Financial Data: Pre-loaded with Inner Mongolia Yili Industrial Group’s historical and projected figures for accurate analysis.
- Completely Customizable Template: Effortlessly adjust key parameters such as revenue growth, WACC, and EBITDA percentage.
- Instantaneous Calculations: View the updated intrinsic value of YILI based on your input changes in real-time.
- Expert Valuation Tool: Tailored for investors, analysts, and consultants aiming for precise DCF evaluations.
- Intuitive Design: Clear layout and straightforward instructions suitable for all skill levels.
Key Features
- Authentic Yili Financial Insights: Gain access to precise pre-loaded historical data and forward-looking projections for Inner Mongolia Yili Industrial Group Co., Ltd. (600887SS).
- Tailorable Forecast Parameters: Modify highlighted cells such as WACC, growth rates, and profit margins to suit your analysis.
- Real-Time Calculations: Enjoy automatic updates to DCF, Net Present Value (NPV), and cash flow assessments.
- Interactive Dashboard: Utilize intuitive charts and summaries to effectively illustrate your valuation findings.
- Designed for All Skill Levels: A straightforward, user-friendly layout catering to investors, CFOs, and consultants alike.
How It Works
- Download: Obtain the preloaded Excel file featuring Inner Mongolia Yili Industrial Group Co., Ltd.'s (600887SS) financial data.
- Customize: Modify forecasts such as revenue growth, EBITDA %, and WACC according to your analysis.
- Update Automatically: Watch as the intrinsic value and NPV calculations refresh in real-time.
- Test Scenarios: Formulate various projections and instantly evaluate different outcomes.
- Make Decisions: Leverage the valuation results to inform your investment strategies.
Why Opt for This Calculator?
- User-Friendly and Accessible: Perfectly crafted for both novices and seasoned professionals.
- Customizable Inputs: Adjust parameters effortlessly to suit your analytical needs.
- Real-Time Insights: Watch as the valuation of Inner Mongolia Yili Industrial Group Co., Ltd. ([600887SS]) updates instantly with every change.
- Preloaded Data: Comes with Yili's actual financial information for immediate assessment.
- Preferred by Experts: Widely utilized by investors and analysts for making well-informed choices.
Who Can Benefit from This Product?
- Investors: Evaluate Yili’s market position before making stock trade decisions.
- CFOs and Financial Analysts: Optimize valuation methodologies and validate financial forecasts.
- Startup Founders: Understand the valuation process of established companies like Yili.
- Consultants: Provide comprehensive valuation insights for your clientele.
- Students and Educators: Utilize live market data to enhance learning of valuation practices.
Contents of the Template
- Detailed DCF Model: An editable template featuring extensive valuation computations.
- Actual Financial Data: Yili’s historical and projected financial information preloaded for your analysis.
- Adjustable Inputs: Modify WACC, growth rates, and tax assumptions to explore various scenarios.
- Financial Statements: Comprehensive annual and quarterly reports for enhanced understanding.
- Essential Ratios: Integrated analysis covering profitability, efficiency, and leverage metrics.
- Visual Dashboard: Charts and tables providing clear and actionable insights.
Disclaimer
All information, articles, and product details provided on this website are for general informational and educational purposes only. We do not claim any ownership over, nor do we intend to infringe upon, any trademarks, copyrights, logos, brand names, or other intellectual property mentioned or depicted on this site. Such intellectual property remains the property of its respective owners, and any references here are made solely for identification or informational purposes, without implying any affiliation, endorsement, or partnership.
We make no representations or warranties, express or implied, regarding the accuracy, completeness, or suitability of any content or products presented. Nothing on this website should be construed as legal, tax, investment, financial, medical, or other professional advice. In addition, no part of this site—including articles or product references—constitutes a solicitation, recommendation, endorsement, advertisement, or offer to buy or sell any securities, franchises, or other financial instruments, particularly in jurisdictions where such activity would be unlawful.
All content is of a general nature and may not address the specific circumstances of any individual or entity. It is not a substitute for professional advice or services. Any actions you take based on the information provided here are strictly at your own risk. You accept full responsibility for any decisions or outcomes arising from your use of this website and agree to release us from any liability in connection with your use of, or reliance upon, the content or products found herein.