
|
DTS Corporation (9682.t) DCF -Bewertung |
Fully Editable: Tailor To Your Needs In Excel Or Sheets
Professional Design: Trusted, Industry-Standard Templates
Investor-Approved Valuation Models
MAC/PC Compatible, Fully Unlocked
No Expertise Is Needed; Easy To Follow
DTS Corporation (9682.T) Bundle
Entdecken Sie den tatsächlichen Wert der DTS Corporation (9682T) mit unserem DCF-Taschenrechner von Professional Grade! Passen Sie die wichtigsten Annahmen an, erkunden Sie verschiedene Szenarien und bewerten Sie die Auswirkungen von Änderungen auf die Bewertung der DTS Corporation (9682T)-alles innerhalb einer benutzerfreundlichen Excel-Vorlage.
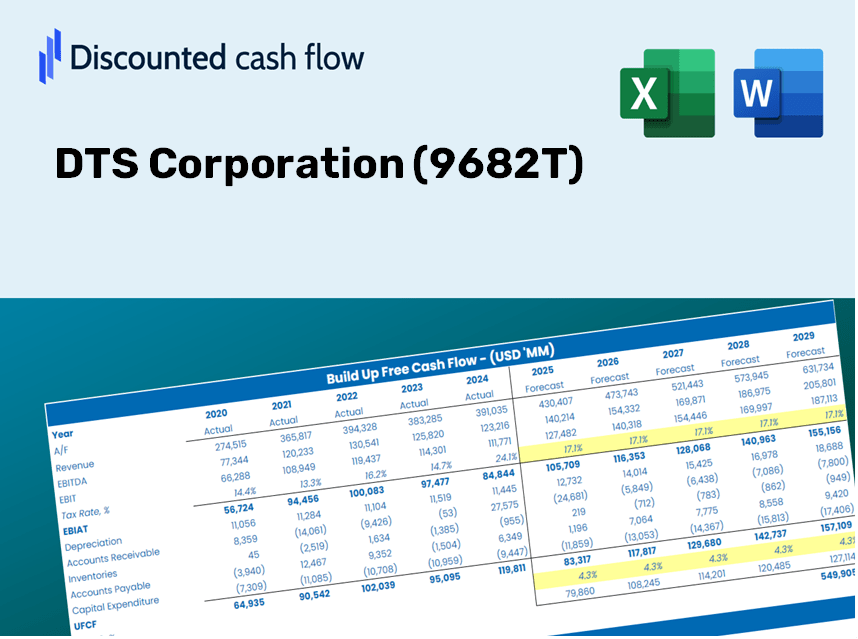
Discounted Cash Flow (DCF) - (USD MM)
| Year | AY1 2021 |
AY2 2022 |
AY3 2023 |
AY4 2024 |
AY5 2025 |
FY1 2026 |
FY2 2027 |
FY3 2028 |
FY4 2029 |
FY5 2030 |
|---|---|---|---|---|---|---|---|---|---|---|
| Revenue | 90,493.2 | 94,452.8 | 106,132.0 | 115,727.0 | 125,908.0 | 136,792.4 | 148,617.6 | 161,465.1 | 175,423.3 | 190,588.1 |
| Revenue Growth, % | 0 | 4.38 | 12.37 | 9.04 | 8.8 | 8.64 | 8.64 | 8.64 | 8.64 | 8.64 |
| EBITDA | 11,708.0 | 12,018.3 | 12,437.0 | 12,699.0 | 16,270.0 | 16,764.2 | 18,213.4 | 19,787.9 | 21,498.5 | 23,356.9 |
| EBITDA, % | 12.94 | 12.72 | 11.72 | 10.97 | 12.92 | 12.26 | 12.26 | 12.26 | 12.26 | 12.26 |
| Depreciation | 577.1 | 602.7 | 742.0 | 1,086.0 | 1,133.0 | 1,043.3 | 1,133.4 | 1,231.4 | 1,337.9 | 1,453.5 |
| Depreciation, % | 0.63774 | 0.63813 | 0.69913 | 0.93842 | 0.89986 | 0.76265 | 0.76265 | 0.76265 | 0.76265 | 0.76265 |
| EBIT | 11,130.9 | 11,415.6 | 11,695.0 | 11,613.0 | 15,137.0 | 15,720.9 | 17,079.9 | 18,556.4 | 20,160.6 | 21,903.4 |
| EBIT, % | 12.3 | 12.09 | 11.02 | 10.03 | 12.02 | 11.49 | 11.49 | 11.49 | 11.49 | 11.49 |
| Total Cash | 44,306.5 | 47,320.9 | 44,330.0 | 39,400.0 | 30,518.0 | 54,474.5 | 59,183.7 | 64,299.9 | 69,858.5 | 75,897.5 |
| Total Cash, percent | .0 | .0 | .0 | .0 | .0 | .0 | .0 | .0 | .0 | .0 |
| Account Receivables | 16,063.7 | 17,235.7 | 21,015.0 | 22,302.0 | 23,825.0 | 25,715.3 | 27,938.3 | 30,353.4 | 32,977.4 | 35,828.2 |
| Account Receivables, % | 17.75 | 18.25 | 19.8 | 19.27 | 18.92 | 18.8 | 18.8 | 18.8 | 18.8 | 18.8 |
| Inventories | 721.2 | 1,457.4 | 945.0 | 892.0 | 1,584.0 | 1,438.8 | 1,563.2 | 1,698.3 | 1,845.2 | 2,004.7 |
| Inventories, % | 0.79693 | 1.54 | 0.8904 | 0.77078 | 1.26 | 1.05 | 1.05 | 1.05 | 1.05 | 1.05 |
| Accounts Payable | 5,157.9 | 6,256.0 | 6,842.0 | 6,697.0 | 7,566.0 | 8,362.4 | 9,085.3 | 9,870.6 | 10,723.9 | 11,651.0 |
| Accounts Payable, % | 5.7 | 6.62 | 6.45 | 5.79 | 6.01 | 6.11 | 6.11 | 6.11 | 6.11 | 6.11 |
| Capital Expenditure | -318.1 | -291.0 | -649.0 | -705.0 | -531.0 | -629.8 | -684.2 | -743.4 | -807.7 | -877.5 |
| Capital Expenditure, % | -0.35154 | -0.30807 | -0.6115 | -0.60919 | -0.42174 | -0.46041 | -0.46041 | -0.46041 | -0.46041 | -0.46041 |
| Tax Rate, % | 29.71 | 29.71 | 29.71 | 29.71 | 29.71 | 29.71 | 29.71 | 29.71 | 29.71 | 29.71 |
| EBITAT | 7,614.8 | 7,874.4 | 8,040.9 | 7,306.2 | 10,639.2 | 10,669.6 | 11,592.0 | 12,594.1 | 13,682.8 | 14,865.7 |
| Depreciation | ||||||||||
| Changes in Account Receivables | ||||||||||
| Changes in Inventories | ||||||||||
| Changes in Accounts Payable | ||||||||||
| Capital Expenditure | ||||||||||
| UFCF | -3,753.3 | 7,376.2 | 5,452.9 | 6,308.2 | 9,895.2 | 10,134.4 | 10,416.7 | 11,317.2 | 12,295.5 | 13,358.5 |
| WACC, % | 5.06 | 5.06 | 5.06 | 5.06 | 5.06 | 5.06 | 5.06 | 5.06 | 5.06 | 5.06 |
| PV UFCF | ||||||||||
| SUM PV UFCF | 49,379.0 | |||||||||
| Long Term Growth Rate, % | 2.00 | |||||||||
| Free cash flow (T + 1) | 13,626 | |||||||||
| Terminal Value | 445,942 | |||||||||
| Present Terminal Value | 348,486 | |||||||||
| Enterprise Value | 397,865 | |||||||||
| Net Debt | -29,922 | |||||||||
| Equity Value | 427,787 | |||||||||
| Diluted Shares Outstanding, MM | 168 | |||||||||
| Equity Value Per Share | 2,552.24 |
Benefits You'll Gain
- Modifiable Forecast Parameters: Effortlessly adjust key variables (growth %, margins, WACC) to explore various scenarios.
- Real-Time Data: DTS Corporation’s financial metrics pre-loaded to facilitate your analysis.
- Automated DCF Calculations: The template computes Net Present Value (NPV) and intrinsic value automatically.
- Customizable and Professional Design: A sleek Excel template tailored to fit your valuation requirements.
- Designed for Analysts and Investors: Perfect for evaluating projections, confirming strategies, and enhancing efficiency.
Highlight Features
- Authentic DTS Financial Data: Gain access to reliable, pre-loaded historical figures and future forecasts.
- Adjustable Forecast Parameters: Modify the highlighted yellow cells for metrics such as WACC, growth rates, and profit margins.
- Real-Time Calculations: Automatically refresh DCF, Net Present Value (NPV), and cash flow analyses.
- Interactive Visual Dashboard: Clear and concise charts and summaries to help you visualize your valuation outcomes.
- Designed for All Skill Levels: A straightforward, user-friendly layout tailored for investors, CFOs, and consultants.
How It Functions
- Download: Obtain the pre-formatted Excel file containing DTS Corporation’s (9682T) financial data.
- Customize: Modify forecasts, such as revenue growth, EBITDA %, and WACC as needed.
- Update Automatically: Real-time updates for intrinsic value and NPV calculations.
- Test Scenarios: Generate multiple projections and instantly compare results.
- Make Decisions: Leverage valuation outcomes to inform your investment strategy.
Why Opt for This Calculator?
- Precise Information: Authentic DTS Corporation financials guarantee dependable valuation outcomes.
- Tailorable: Modify essential parameters such as growth rates, WACC, and tax rates to fit your forecasts.
- Efficient: Ready-made calculations save you the hassle of starting from zero.
- Expert-Level Tool: Crafted for investors, analysts, and consultants working with [9682T].
- Accessible: User-friendly design and clear instructions make it straightforward for everyone.
Who Can Benefit from This Product?
- Individual Investors: Gain insights to make well-informed decisions about trading DTS Corporation (9682T) stock.
- Financial Analysts: Enhance valuation workflows with accessible financial models tailored for DTS Corporation (9682T).
- Consultants: Provide clients with timely and accurate valuation analyses for DTS Corporation (9682T).
- Business Owners: Learn how major firms like DTS Corporation (9682T) are valued to refine your own business strategies.
- Finance Students: Explore valuation methods through practical applications using data from DTS Corporation (9682T).
Contents of the Template
- Pre-Filled DCF Model: DTS Corporation’s financial data preloaded for immediate analysis.
- WACC Calculator: Comprehensive calculations for Weighted Average Cost of Capital.
- Financial Ratios: Assess DTS Corporation’s profitability, leverage, and operational efficiency.
- Editable Inputs: Adjust assumptions like growth, margins, and CAPEX to align with your scenarios.
- Financial Statements: Access annual and quarterly reports for in-depth evaluation.
- Interactive Dashboard: Conveniently visualize essential valuation metrics and outcomes.
Disclaimer
All information, articles, and product details provided on this website are for general informational and educational purposes only. We do not claim any ownership over, nor do we intend to infringe upon, any trademarks, copyrights, logos, brand names, or other intellectual property mentioned or depicted on this site. Such intellectual property remains the property of its respective owners, and any references here are made solely for identification or informational purposes, without implying any affiliation, endorsement, or partnership.
We make no representations or warranties, express or implied, regarding the accuracy, completeness, or suitability of any content or products presented. Nothing on this website should be construed as legal, tax, investment, financial, medical, or other professional advice. In addition, no part of this site—including articles or product references—constitutes a solicitation, recommendation, endorsement, advertisement, or offer to buy or sell any securities, franchises, or other financial instruments, particularly in jurisdictions where such activity would be unlawful.
All content is of a general nature and may not address the specific circumstances of any individual or entity. It is not a substitute for professional advice or services. Any actions you take based on the information provided here are strictly at your own risk. You accept full responsibility for any decisions or outcomes arising from your use of this website and agree to release us from any liability in connection with your use of, or reliance upon, the content or products found herein.