
|
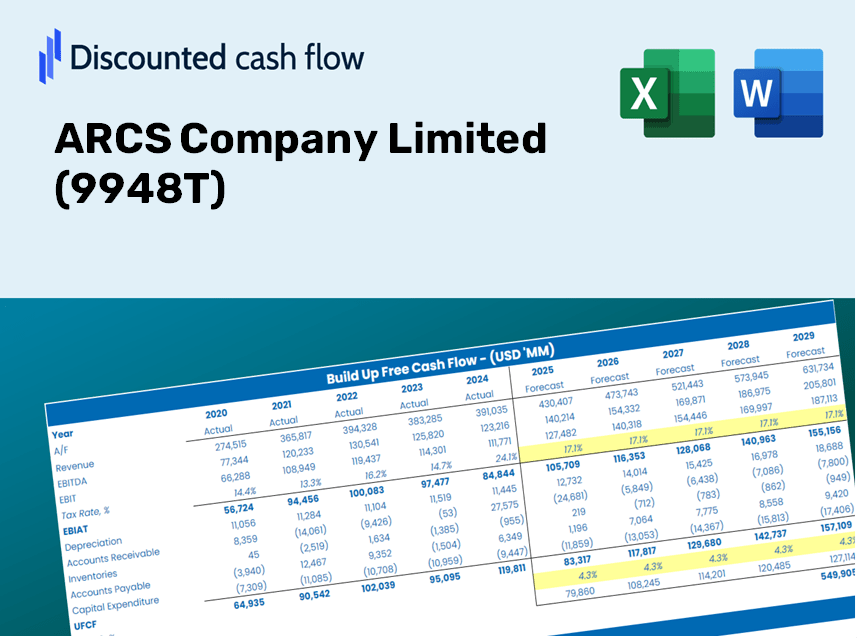
ARCS Company Limited (9948.T) DCF -Bewertung |
Fully Editable: Tailor To Your Needs In Excel Or Sheets
Professional Design: Trusted, Industry-Standard Templates
Investor-Approved Valuation Models
MAC/PC Compatible, Fully Unlocked
No Expertise Is Needed; Easy To Follow
ARCS Company Limited (9948.T) Bundle
Unser (9948T) DCF-Taschenrechner für Genauigkeit entwickelt und ermöglicht es Ihnen, die Bewertung von ARCS Company Limited unter Verwendung realer Finanzdaten zu bewerten, und bietet vollständige Flexibilität, um alle wesentlichen Parameter für verbesserte Projektionen zu ändern.
Benefits of Choosing ARCS Company Limited (9948T)
- Customizable Excel Template: A fully adaptable Excel-based DCF Calculator featuring pre-filled financial data for ARCS Company Limited.
- Accurate Data Insights: Access to historical performance and future projections (highlighted in the yellow cells).
- Adjustable Forecast Variables: Modify key assumptions such as revenue growth, EBITDA %, and WACC to suit your needs.
- Instant Calculation Updates: Quickly observe how your changes affect ARCS Company Limited's valuation.
- Essential Tool for Professionals: Ideal for investors, CFOs, consultants, and financial analysts alike.
- Intuitive User Interface: Designed for simplicity and ease of navigation, complete with step-by-step guidance.
Key Features
- Customizable Forecast Inputs: Adjust essential variables such as revenue growth, EBITDA %, and capital expenditures.
- Instant DCF Valuation: Quickly computes intrinsic value, NPV, and other key metrics.
- High-Precision Accuracy: Leverages ARCS Company Limited’s real financial data for dependable valuation results.
- Simplified Scenario Analysis: Effortlessly evaluate various assumptions and their outcomes.
- Efficiency Booster: Avoid the hassle of creating intricate valuation models from the ground up.
How It Functions
- 1. Access the Template: Download and open the Excel file featuring ARCS Company Limited's (9948T) preloaded data.
- 2. Modify Assumptions: Adjust crucial inputs such as growth rates, WACC, and capital expenditures.
- 3. View Results in Real-Time: The DCF model automatically calculates the intrinsic value and NPV.
- 4. Evaluate Scenarios: Analyze various forecasts to explore different valuation possibilities.
- 5. Use with Assurance: Present expert valuation insights to bolster your decision-making process.
Why Opt for the ARCS Calculator?
- Precision: Up-to-date ARCS Company Limited financials guarantee reliable data.
- Adaptability: Built for users to easily experiment with and adjust inputs.
- Efficiency: Eliminate the need to construct a DCF model from the ground up.
- Expert-Grade: Crafted with the precision and functionality suited for CFOs.
- Intuitive: Designed for simplicity, making it accessible to users without extensive financial modeling expertise.
Who Can Benefit from ARCS Company Limited (9948T)?
- Finance Students: Discover valuation methods and put them into practice with authentic data.
- Academics: Utilize industry-standard models in your teaching materials or research projects.
- Investors: Challenge your own predictions and evaluate the valuation results for ARCS Company Limited (9948T).
- Analysts: Enhance your efficiency with a ready-to-use, customizable DCF model tailored to ARCS Company Limited (9948T).
- Small Business Owners: Learn how major public companies like ARCS Company Limited (9948T) are assessed in the market.
Contents of the Template
- Pre-Filled Data: Contains historical financial data and forecasts for ARCS Company Limited (9948T).
- Discounted Cash Flow Model: An editable DCF valuation model featuring automatic calculations.
- Weighted Average Cost of Capital (WACC): A specific sheet for WACC calculations based on user-defined inputs.
- Key Financial Ratios: Evaluate ARCS Company Limited’s (9948T) profitability, efficiency, and financial leverage.
- Customizable Inputs: Easily modify revenue growth, margins, and tax rates.
- Clear Dashboard: Visual displays including charts and tables that summarize essential valuation results.
Disclaimer
All information, articles, and product details provided on this website are for general informational and educational purposes only. We do not claim any ownership over, nor do we intend to infringe upon, any trademarks, copyrights, logos, brand names, or other intellectual property mentioned or depicted on this site. Such intellectual property remains the property of its respective owners, and any references here are made solely for identification or informational purposes, without implying any affiliation, endorsement, or partnership.
We make no representations or warranties, express or implied, regarding the accuracy, completeness, or suitability of any content or products presented. Nothing on this website should be construed as legal, tax, investment, financial, medical, or other professional advice. In addition, no part of this site—including articles or product references—constitutes a solicitation, recommendation, endorsement, advertisement, or offer to buy or sell any securities, franchises, or other financial instruments, particularly in jurisdictions where such activity would be unlawful.
All content is of a general nature and may not address the specific circumstances of any individual or entity. It is not a substitute for professional advice or services. Any actions you take based on the information provided here are strictly at your own risk. You accept full responsibility for any decisions or outcomes arising from your use of this website and agree to release us from any liability in connection with your use of, or reliance upon, the content or products found herein.