
|
DCF -Bewertung der Atlantic American Corporation (AAME) |
Fully Editable: Tailor To Your Needs In Excel Or Sheets
Professional Design: Trusted, Industry-Standard Templates
Investor-Approved Valuation Models
MAC/PC Compatible, Fully Unlocked
No Expertise Is Needed; Easy To Follow
Atlantic American Corporation (AAME) Bundle
Verbessern Sie Ihre Anlagestrategien mit dem (Aame) DCF -Taschenrechner! Tauchen Sie Finanzdaten der authentischen Atlantic American Corporation ein, passen Sie Wachstumsprognosen und -kosten an und beobachten Sie sofort, wie sich diese Modifikationen auf den inneren Wert von (Aame) auswirken.
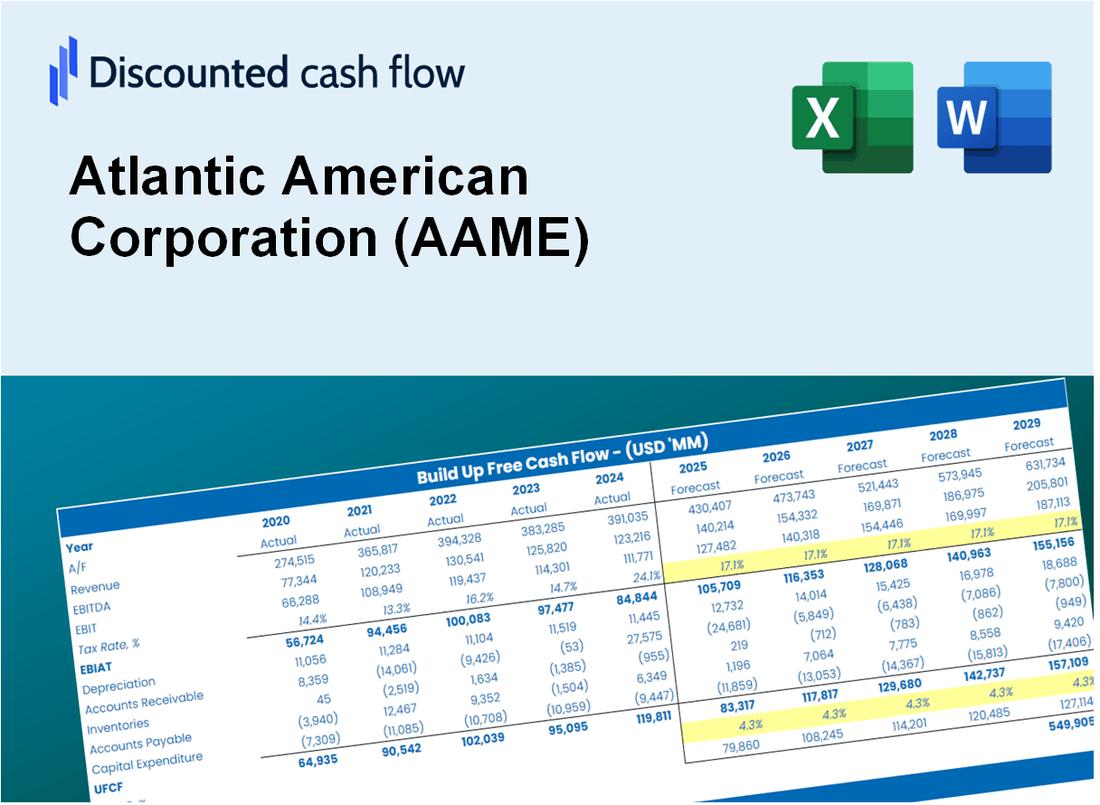
Discounted Cash Flow (DCF) - (USD MM)
| Year | AY1 2020 |
AY2 2021 |
AY3 2022 |
AY4 2023 |
AY5 2024 |
FY1 2025 |
FY2 2026 |
FY3 2027 |
FY4 2028 |
FY5 2029 |
|---|---|---|---|---|---|---|---|---|---|---|
| Revenue | 195.3 | 199.6 | 187.9 | 186.8 | 188.2 | 186.6 | 184.9 | 183.3 | 181.7 | 180.1 |
| Revenue Growth, % | 0 | 2.15 | -5.86 | -0.56321 | 0.76769 | -0.87675 | -0.87675 | -0.87675 | -0.87675 | -0.87675 |
| EBITDA | 18.1 | 7.7 | 4.9 | 3.4 | -1.5 | 6.3 | 6.2 | 6.1 | 6.1 | 6.0 |
| EBITDA, % | 9.26 | 3.85 | 2.63 | 1.8 | -0.78575 | 3.35 | 3.35 | 3.35 | 3.35 | 3.35 |
| Depreciation | 1.0 | 1.0 | .9 | .7 | .4 | .8 | .7 | .7 | .7 | .7 |
| Depreciation, % | 0.50167 | 0.50262 | 0.47378 | 0.34905 | 0.19445 | 0.40431 | 0.40431 | 0.40431 | 0.40431 | 0.40431 |
| EBIT | 17.1 | 6.7 | 4.0 | 2.7 | -1.8 | 5.5 | 5.5 | 5.4 | 5.4 | 5.3 |
| EBIT, % | 8.76 | 3.35 | 2.15 | 1.45 | -0.9802 | 2.95 | 2.95 | 2.95 | 2.95 | 2.95 |
| Total Cash | 273.4 | 285.7 | 237.6 | 28.3 | 35.6 | 124.7 | 123.6 | 122.5 | 121.4 | 120.3 |
| Total Cash, percent | .0 | .0 | .0 | .0 | .0 | .0 | .0 | .0 | .0 | .0 |
| Account Receivables | 56.6 | 42.4 | 41.3 | 44.8 | 50.4 | 45.9 | 45.5 | 45.1 | 44.7 | 44.3 |
| Account Receivables, % | 28.97 | 21.23 | 21.98 | 23.98 | 26.78 | 24.59 | 24.59 | 24.59 | 24.59 | 24.59 |
| Inventories | .0 | -41.4 | -48.0 | .0 | .0 | -17.3 | -17.1 | -17.0 | -16.8 | -16.7 |
| Inventories, % | 0 | -20.77 | -25.57 | 0 | 0 | -9.27 | -9.27 | -9.27 | -9.27 | -9.27 |
| Accounts Payable | 26.4 | 25.5 | 26.5 | 24.8 | .0 | 20.0 | 19.8 | 19.7 | 19.5 | 19.3 |
| Accounts Payable, % | 13.52 | 12.76 | 14.09 | 13.28 | 0 | 10.73 | 10.73 | 10.73 | 10.73 | 10.73 |
| Capital Expenditure | -.2 | -.1 | -.1 | -.1 | -.2 | -.2 | -.1 | -.1 | -.1 | -.1 |
| Capital Expenditure, % | -0.11927 | -0.05361957 | -0.06707444 | -0.04282816 | -0.11954 | -0.0804666 | -0.0804666 | -0.0804666 | -0.0804666 | -0.0804666 |
| Tax Rate, % | 18.92 | 18.92 | 18.92 | 18.92 | 18.92 | 18.92 | 18.92 | 18.92 | 18.92 | 18.92 |
| EBITAT | 13.4 | 5.4 | 2.9 | .8 | -1.5 | 3.8 | 3.7 | 3.7 | 3.7 | 3.6 |
| Depreciation | ||||||||||
| Changes in Account Receivables | ||||||||||
| Changes in Inventories | ||||||||||
| Changes in Accounts Payable | ||||||||||
| Capital Expenditure | ||||||||||
| UFCF | -16.0 | 61.0 | 12.4 | -51.8 | -31.8 | 46.2 | 4.4 | 4.4 | 4.3 | 4.3 |
| WACC, % | 7.27 | 7.35 | 7.07 | 5.57 | 7.36 | 6.92 | 6.92 | 6.92 | 6.92 | 6.92 |
| PV UFCF | ||||||||||
| SUM PV UFCF | 57.1 | |||||||||
| Long Term Growth Rate, % | 2.00 | |||||||||
| Free cash flow (T + 1) | 4 | |||||||||
| Terminal Value | 89 | |||||||||
| Present Terminal Value | 64 | |||||||||
| Enterprise Value | 121 | |||||||||
| Net Debt | 2 | |||||||||
| Equity Value | 119 | |||||||||
| Diluted Shares Outstanding, MM | 20 | |||||||||
| Equity Value Per Share | 5.82 |
What You Will Get
- Real AAME Financials: Access to historical and projected data for precise valuation.
- Customizable Inputs: Adjust WACC, tax rates, revenue growth, and capital expenditures as needed.
- Dynamic Calculations: Intrinsic value and NPV are computed automatically.
- Scenario Analysis: Evaluate various scenarios to assess Atlantic American Corporation’s future performance.
- User-Friendly Design: Designed for professionals but easy for beginners to navigate.
Key Features
- Pre-Loaded Data: Atlantic American Corporation’s historical financial statements and pre-filled forecasts.
- Fully Adjustable Inputs: Modify WACC, tax rates, revenue growth, and EBITDA margins as needed.
- Instant Results: View Atlantic American Corporation’s intrinsic value recalculated in real time.
- Clear Visual Outputs: Dashboard charts illustrate valuation results and key metrics effectively.
- Built for Accuracy: A professional tool designed for analysts, investors, and finance professionals.
How It Works
- 1. Access the Template: Download and open the Excel file containing Atlantic American Corporation’s (AAME) preloaded financial data.
- 2. Adjust Key Inputs: Modify essential variables such as growth projections, WACC, and capital expenditure estimates.
- 3. View Results in Real-Time: The DCF model automatically computes intrinsic value and NPV based on your inputs.
- 4. Explore Different Scenarios: Analyze various forecasts to evaluate different valuation possibilities.
- 5. Present with Assurance: Deliver professional valuation analyses to back your strategic decisions.
Why Choose This Calculator for Atlantic American Corporation (AAME)?
- Accurate Data: Reliable financial metrics for Atlantic American Corporation ensure precise valuation outcomes.
- Customizable: Tailor essential parameters such as growth rates, WACC, and tax rates to align with your forecasts.
- Time-Saving: Ready-made calculations save you the hassle of starting from the ground up.
- Professional-Grade Tool: Crafted for investors, analysts, and consultants focused on Atlantic American Corporation.
- User-Friendly: Easy-to-navigate design and clear instructions make it accessible for all users.
Who Should Use This Product?
- Finance Students: Understand valuation methodologies and apply them to real-world data, particularly for Atlantic American Corporation (AAME).
- Academics: Integrate industry-standard valuation models into your teaching or research focused on Atlantic American Corporation (AAME).
- Investors: Validate your investment hypotheses and evaluate the valuation metrics of Atlantic American Corporation (AAME).
- Analysts: Enhance your analysis efficiency with a customizable DCF model tailored for Atlantic American Corporation (AAME).
- Small Business Owners: Discover how large corporations like Atlantic American Corporation (AAME) are evaluated in the market.
What the Template Contains
- Comprehensive DCF Model: Editable template featuring detailed valuation calculations tailored for Atlantic American Corporation (AAME).
- Real-World Data: Atlantic American Corporation’s historical and projected financials preloaded for thorough analysis.
- Customizable Parameters: Modify WACC, growth rates, and tax assumptions to explore various scenarios.
- Financial Statements: Complete annual and quarterly breakdowns for enhanced insights into the company’s performance.
- Key Ratios: Integrated analysis for profitability, efficiency, and leverage metrics specific to Atlantic American Corporation (AAME).
- Dashboard with Visual Outputs: Engaging charts and tables designed to present clear, actionable results.
Disclaimer
All information, articles, and product details provided on this website are for general informational and educational purposes only. We do not claim any ownership over, nor do we intend to infringe upon, any trademarks, copyrights, logos, brand names, or other intellectual property mentioned or depicted on this site. Such intellectual property remains the property of its respective owners, and any references here are made solely for identification or informational purposes, without implying any affiliation, endorsement, or partnership.
We make no representations or warranties, express or implied, regarding the accuracy, completeness, or suitability of any content or products presented. Nothing on this website should be construed as legal, tax, investment, financial, medical, or other professional advice. In addition, no part of this site—including articles or product references—constitutes a solicitation, recommendation, endorsement, advertisement, or offer to buy or sell any securities, franchises, or other financial instruments, particularly in jurisdictions where such activity would be unlawful.
All content is of a general nature and may not address the specific circumstances of any individual or entity. It is not a substitute for professional advice or services. Any actions you take based on the information provided here are strictly at your own risk. You accept full responsibility for any decisions or outcomes arising from your use of this website and agree to release us from any liability in connection with your use of, or reliance upon, the content or products found herein.