
|
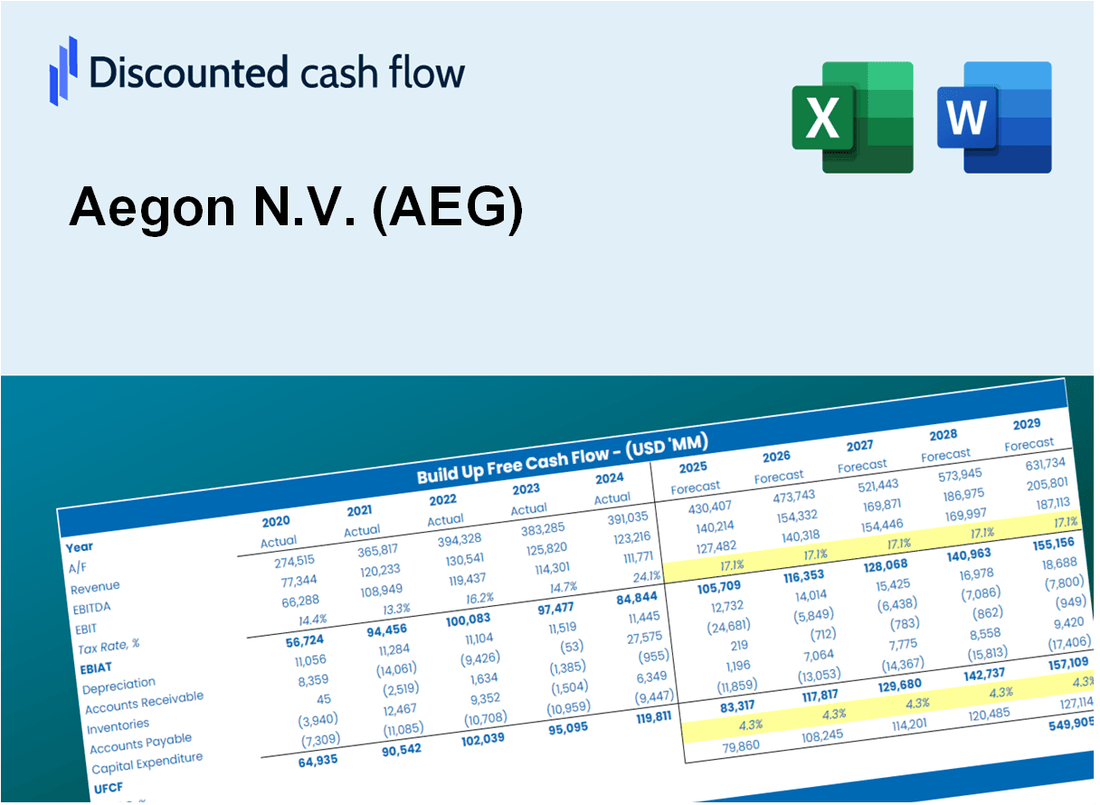
Aegon N.V. (AEG) DCF -Bewertung |
Fully Editable: Tailor To Your Needs In Excel Or Sheets
Professional Design: Trusted, Industry-Standard Templates
Investor-Approved Valuation Models
MAC/PC Compatible, Fully Unlocked
No Expertise Is Needed; Easy To Follow
Aegon N.V. (AEG) Bundle
Mit unserem AEG DCF-Taschenrechner, der für die Genauigkeit entwickelt wurde, können Sie die Bewertung von AEGON N.V. mithilfe realer Finanzinformationen bewerten und vollständige Flexibilität bieten, um alle wesentlichen Parameter für verbesserte Projektionen zu ändern.
Discounted Cash Flow (DCF) - (USD MM)
| Year | AY1 2020 |
AY2 2021 |
AY3 2022 |
AY4 2023 |
AY5 2024 |
FY1 2025 |
FY2 2026 |
FY3 2027 |
FY4 2028 |
FY5 2029 |
|---|---|---|---|---|---|---|---|---|---|---|
| Revenue | 47,314.9 | 54,124.8 | -25,189.7 | 15,104.7 | 22,717.6 | 15,038.7 | 9,955.4 | 6,590.3 | 4,362.7 | 2,888.0 |
| Revenue Growth, % | 0 | 14.39 | -146.54 | -159.96 | 50.4 | -33.8 | -33.8 | -33.8 | -33.8 | -33.8 |
| EBITDA | 196.7 | 2,999.3 | 1,167.4 | -237.4 | 739.1 | 90.4 | 59.8 | 39.6 | 26.2 | 17.4 |
| EBITDA, % | 0.41571 | 5.54 | -4.63 | -1.57 | 3.25 | 0.60085 | 0.60085 | 0.60085 | 0.60085 | 0.60085 |
| Depreciation | 840.3 | 1,358.2 | 196.7 | 39.6 | -36.1 | 108.5 | 71.8 | 47.6 | 31.5 | 20.8 |
| Depreciation, % | 1.78 | 2.51 | -0.78085 | 0.26198 | -0.15882 | 0.72156 | 0.72156 | 0.72156 | 0.72156 | 0.72156 |
| EBIT | -643.6 | 1,641.1 | 970.7 | -277.0 | 775.1 | -18.2 | -12.0 | -8.0 | -5.3 | -3.5 |
| EBIT, % | -1.36 | 3.03 | -3.85 | -1.83 | 3.41 | -0.12071 | -0.12071 | -0.12071 | -0.12071 | -0.12071 |
| Total Cash | 126,861.0 | 125,995.1 | 74,852.2 | 4,741.6 | 67,718.8 | 6,959.7 | 4,607.2 | 3,049.9 | 2,019.0 | 1,336.5 |
| Total Cash, percent | .0 | .0 | .0 | .0 | .0 | .0 | .0 | .0 | .0 | .0 |
| Account Receivables | 7,944.6 | 6,543.3 | 9,144.6 | 4,151.5 | 4,457.6 | 1,193.6 | 790.1 | 523.1 | 346.3 | 229.2 |
| Account Receivables, % | 16.79 | 12.09 | -36.3 | 27.48 | 19.62 | 7.94 | 7.94 | 7.94 | 7.94 | 7.94 |
| Inventories | .0 | -21,865.7 | -125,285.1 | .0 | .0 | 1,792.7 | 1,186.7 | 785.6 | 520.0 | 344.3 |
| Inventories, % | 0 | -40.4 | 497.37 | 0 | 0 | 11.92 | 11.92 | 11.92 | 11.92 | 11.92 |
| Accounts Payable | 3,203.0 | 3,584.7 | 1,324.5 | 2,460.4 | 1,536.3 | 938.0 | 620.9 | 411.1 | 272.1 | 180.1 |
| Accounts Payable, % | 6.77 | 6.62 | -5.26 | 16.29 | 6.76 | 6.24 | 6.24 | 6.24 | 6.24 | 6.24 |
| Capital Expenditure | -139.7 | -130.4 | -114.1 | -75.7 | -59.4 | -39.0 | -25.8 | -17.1 | -11.3 | -7.5 |
| Capital Expenditure, % | -0.29518 | -0.24084 | 0.4528 | -0.50085 | -0.26128 | -0.25963 | -0.25963 | -0.25963 | -0.25963 | -0.25963 |
| Tax Rate, % | -4.24 | -4.24 | -4.24 | -4.24 | -4.24 | -4.24 | -4.24 | -4.24 | -4.24 | -4.24 |
| EBITAT | 30.3 | 2,791.5 | -669.0 | -126.8 | 808.0 | -8.9 | -5.9 | -3.9 | -2.6 | -1.7 |
| Depreciation | ||||||||||
| Changes in Account Receivables | ||||||||||
| Changes in Inventories | ||||||||||
| Changes in Accounts Payable | ||||||||||
| Capital Expenditure | ||||||||||
| UFCF | -4,010.7 | 27,668.1 | 97,971.6 | -119,319.1 | -517.6 | 933.6 | 732.4 | 484.9 | 321.0 | 212.5 |
| WACC, % | 5.05 | 6.06 | 5.05 | 5.51 | 6.06 | 5.54 | 5.54 | 5.54 | 5.54 | 5.54 |
| PV UFCF | ||||||||||
| SUM PV UFCF | 2,375.4 | |||||||||
| Long Term Growth Rate, % | 2.00 | |||||||||
| Free cash flow (T + 1) | 217 | |||||||||
| Terminal Value | 6,117 | |||||||||
| Present Terminal Value | 4,671 | |||||||||
| Enterprise Value | 7,046 | |||||||||
| Net Debt | 1,777 | |||||||||
| Equity Value | 5,269 | |||||||||
| Diluted Shares Outstanding, MM | 2,010 | |||||||||
| Equity Value Per Share | 2.62 |
What You Will Receive
- Pre-Filled Financial Model: Aegon N.V.’s actual data allows for accurate DCF valuation.
- Comprehensive Forecast Control: Modify revenue growth, profit margins, WACC, and other essential factors.
- Real-Time Calculations: Automatic updates ensure immediate visibility of results as adjustments are made.
- Investor-Ready Template: A polished Excel file crafted for high-quality valuation.
- Customizable and Reusable: Designed for adaptability, enabling repeated use for in-depth forecasts.
Key Features
- Comprehensive Data: Aegon N.V.’s historical financial reports and pre-filled projections.
- Customizable Parameters: Adjust WACC, tax rates, revenue growth, and EBITDA margins as needed.
- Real-Time Insights: Monitor Aegon N.V.’s intrinsic value calculations instantly.
- Intuitive Visualizations: Dashboard graphs present valuation outcomes and essential metrics clearly.
- Designed for Precision: A specialized tool for analysts, investors, and finance professionals.
How It Functions
- Download: Obtain the pre-formatted Excel file featuring Aegon N.V.'s (AEG) financial data.
- Customize: Modify projections, such as revenue growth, EBITDA %, and WACC.
- Update Automatically: The intrinsic value and NPV calculations refresh in real-time.
- Test Scenarios: Develop various forecasts and instantly compare results.
- Make Decisions: Utilize the valuation findings to inform your investment approach.
Why Choose Aegon N.V. (AEG)?
- Time-Efficient: Access comprehensive financial solutions without the hassle of starting from scratch.
- Enhanced Precision: Utilize verified data and methodologies to minimize valuation discrepancies.
- Completely Customizable: Adjust the framework to align with your unique financial assumptions and forecasts.
- User-Friendly: Intuitive visuals and outputs facilitate straightforward analysis of results.
- Preferred by Professionals: Crafted for industry experts who prioritize accuracy and functionality.
Who Should Use This Product?
- Institutional Investors: Develop comprehensive and accurate valuation models for assessing Aegon N.V. (AEG) investments.
- Corporate Finance Departments: Evaluate valuation scenarios to inform strategic decisions within the organization.
- Financial Consultants: Deliver precise valuation insights regarding Aegon N.V. (AEG) to clients.
- Academics and Students: Utilize real-time data to enhance learning and practice in financial modeling.
- Market Analysts: Gain insights into the valuation of insurance and financial services companies like Aegon N.V. (AEG).
What the Template Contains
- Pre-Filled DCF Model: Aegon N.V.'s (AEG) financial data preloaded for immediate use.
- WACC Calculator: Detailed calculations for Weighted Average Cost of Capital for Aegon N.V. (AEG).
- Financial Ratios: Evaluate Aegon N.V.'s (AEG) profitability, leverage, and efficiency.
- Editable Inputs: Change assumptions such as growth, margins, and CAPEX to fit your scenarios for Aegon N.V. (AEG).
- Financial Statements: Annual and quarterly reports to support detailed analysis of Aegon N.V. (AEG).
- Interactive Dashboard: Easily visualize key valuation metrics and results for Aegon N.V. (AEG).
Disclaimer
All information, articles, and product details provided on this website are for general informational and educational purposes only. We do not claim any ownership over, nor do we intend to infringe upon, any trademarks, copyrights, logos, brand names, or other intellectual property mentioned or depicted on this site. Such intellectual property remains the property of its respective owners, and any references here are made solely for identification or informational purposes, without implying any affiliation, endorsement, or partnership.
We make no representations or warranties, express or implied, regarding the accuracy, completeness, or suitability of any content or products presented. Nothing on this website should be construed as legal, tax, investment, financial, medical, or other professional advice. In addition, no part of this site—including articles or product references—constitutes a solicitation, recommendation, endorsement, advertisement, or offer to buy or sell any securities, franchises, or other financial instruments, particularly in jurisdictions where such activity would be unlawful.
All content is of a general nature and may not address the specific circumstances of any individual or entity. It is not a substitute for professional advice or services. Any actions you take based on the information provided here are strictly at your own risk. You accept full responsibility for any decisions or outcomes arising from your use of this website and agree to release us from any liability in connection with your use of, or reliance upon, the content or products found herein.