
|
Affirm Holdings, Inc. (AFRM) DCF -Bewertung |
Fully Editable: Tailor To Your Needs In Excel Or Sheets
Professional Design: Trusted, Industry-Standard Templates
Investor-Approved Valuation Models
MAC/PC Compatible, Fully Unlocked
No Expertise Is Needed; Easy To Follow
Affirm Holdings, Inc. (AFRM) Bundle
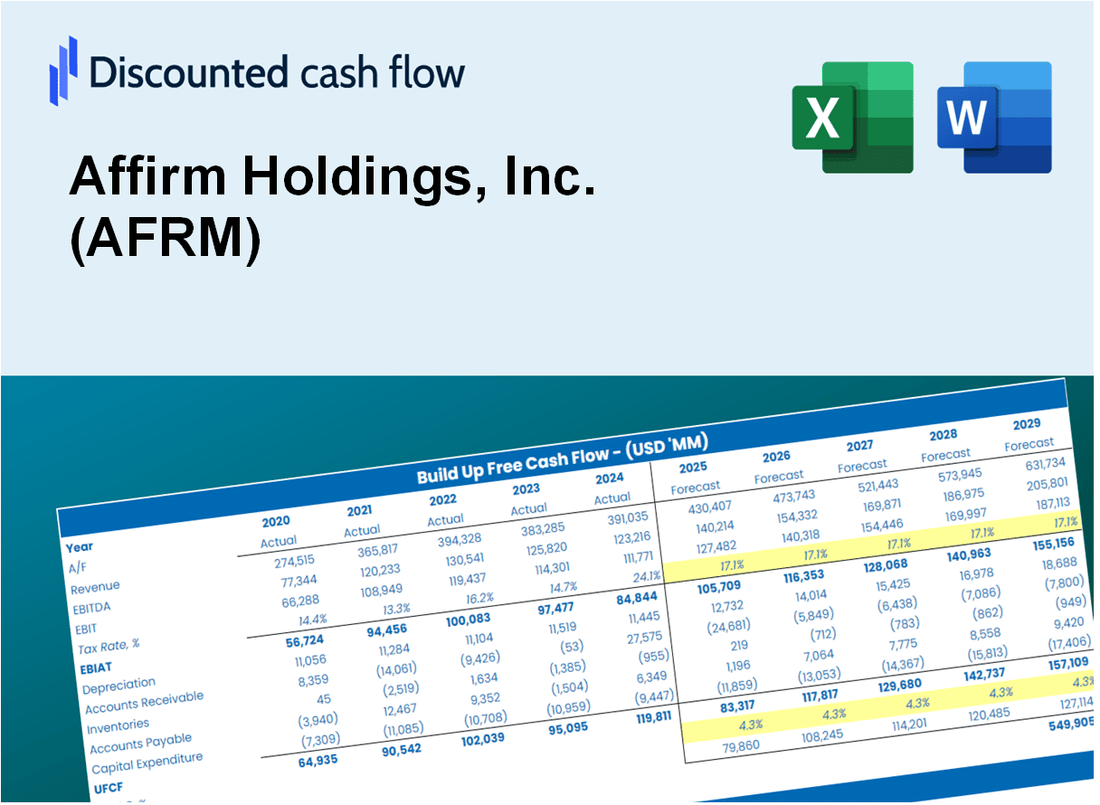
Gewinnen Sie einen Einblick in Ihre Bewertungsanalyse für Affirm Holdings, Inc. (AFRM) mit unserem ausgefeilten DCF -Taschenrechner! Diese Excel-Vorlage mit Echtzeitdaten für (AFRM) ermöglicht es Ihnen, Prognosen und Annahmen anzupassen, sodass Sie den inneren Wert von Affirm Holdings, Inc. genau bestimmen können.
Discounted Cash Flow (DCF) - (USD MM)
| Year | AY1 2021 |
AY2 2022 |
AY3 2023 |
AY4 2024 |
AY5 2025 |
FY1 2026 |
FY2 2027 |
FY3 2028 |
FY4 2029 |
FY5 2030 |
|---|---|---|---|---|---|---|---|---|---|---|
| Revenue | 870.5 | 1,349.3 | 1,588.0 | 2,323.0 | 3,224.4 | 4,496.3 | 6,270.0 | 8,743.4 | 12,192.4 | 17,001.9 |
| Revenue Growth, % | 0 | 55.01 | 17.69 | 46.29 | 38.8 | 39.45 | 39.45 | 39.45 | 39.45 | 39.45 |
| EBITDA | -370.7 | -602.4 | -671.6 | .0 | 712.0 | -966.2 | -1,347.3 | -1,878.8 | -2,620.0 | -3,653.5 |
| EBITDA, % | -42.59 | -44.65 | -42.29 | 0 | 22.08 | -21.49 | -21.49 | -21.49 | -21.49 | -21.49 |
| Depreciation | 20.0 | 52.7 | 134.6 | 169.0 | 225.1 | 260.2 | 362.9 | 506.0 | 705.7 | 984.0 |
| Depreciation, % | 2.3 | 3.91 | 8.48 | 7.28 | 6.98 | 5.79 | 5.79 | 5.79 | 5.79 | 5.79 |
| EBIT | -390.7 | -655.1 | -806.2 | -169.0 | 486.9 | -1,226.4 | -1,710.2 | -2,384.9 | -3,325.6 | -4,637.5 |
| EBIT, % | -44.88 | -48.55 | -50.77 | -7.28 | 15.1 | -27.28 | -27.28 | -27.28 | -27.28 | -27.28 |
| Total Cash | 1,482.7 | 2,850.5 | 2,066.7 | 2,144.7 | 2,225.9 | 4,148.9 | 5,785.5 | 8,067.7 | 11,250.1 | 15,688.0 |
| Total Cash, percent | .0 | .0 | .0 | .0 | .0 | .0 | .0 | .0 | .0 | .0 |
| Account Receivables | 2,022.6 | 2,490.2 | 4,414.7 | 5,732.3 | 7,058.6 | 4,496.3 | 6,270.0 | 8,743.4 | 12,192.4 | 17,001.9 |
| Account Receivables, % | 232.35 | 184.56 | 278.01 | 246.76 | 218.91 | 100 | 100 | 100 | 100 | 100 |
| Inventories | .0 | .0 | .0 | .0 | .0 | .0 | .0 | .0 | .0 | .0 |
| Inventories, % | 0 | 0 | 0 | 0 | 0 | 0 | 0 | 0 | 0 | 0 |
| Accounts Payable | 57.8 | 33.1 | 28.6 | 41.0 | 82.8 | 136.9 | 190.9 | 266.2 | 371.2 | 517.6 |
| Accounts Payable, % | 6.64 | 2.45 | 1.8 | 1.77 | 2.57 | 3.04 | 3.04 | 3.04 | 3.04 | 3.04 |
| Capital Expenditure | -20.3 | -111.7 | -120.8 | -159.3 | -192.2 | -279.0 | -389.1 | -542.6 | -756.6 | -1,055.1 |
| Capital Expenditure, % | -2.33 | -8.28 | -7.61 | -6.86 | -5.96 | -6.21 | -6.21 | -6.21 | -6.21 | -6.21 |
| Tax Rate, % | 15.1 | 15.1 | 15.1 | 15.1 | 15.1 | 15.1 | 15.1 | 15.1 | 15.1 | 15.1 |
| EBITAT | -388.6 | -639.4 | -803.1 | -169.8 | 413.4 | -1,181.2 | -1,647.2 | -2,297.0 | -3,203.0 | -4,466.5 |
| Depreciation | ||||||||||
| Changes in Account Receivables | ||||||||||
| Changes in Inventories | ||||||||||
| Changes in Accounts Payable | ||||||||||
| Capital Expenditure | ||||||||||
| UFCF | -2,353.6 | -1,190.7 | -2,718.2 | -1,465.1 | -838.2 | 1,416.2 | -3,393.1 | -4,731.6 | -6,598.0 | -9,200.7 |
| WACC, % | 16.93 | 16.9 | 16.93 | 16.94 | 16.74 | 16.89 | 16.89 | 16.89 | 16.89 | 16.89 |
| PV UFCF | ||||||||||
| SUM PV UFCF | -11,985.9 | |||||||||
| Long Term Growth Rate, % | 2.00 | |||||||||
| Free cash flow (T + 1) | -9,385 | |||||||||
| Terminal Value | -63,037 | |||||||||
| Present Terminal Value | -28,890 | |||||||||
| Enterprise Value | -40,876 | |||||||||
| Net Debt | 6,499 | |||||||||
| Equity Value | -47,375 | |||||||||
| Diluted Shares Outstanding, MM | 341 | |||||||||
| Equity Value Per Share | -138.92 |
What You Will Get
- Real AFRM Financial Data: Pre-filled with Affirm Holdings’ historical and projected data for precise analysis.
- Fully Editable Template: Modify key inputs like revenue growth, WACC, and EBITDA % with ease.
- Automatic Calculations: See Affirm’s intrinsic value update instantly based on your changes.
- Professional Valuation Tool: Designed for investors, analysts, and consultants seeking accurate DCF results.
- User-Friendly Design: Simple structure and clear instructions for all experience levels.
Key Features
- Comprehensive Financial Data: Gain access to precise historical data and future forecasts for Affirm Holdings, Inc. (AFRM).
- Adjustable Forecast Parameters: Modify highlighted cells to tailor assumptions like WACC, growth rates, and profit margins.
- Real-Time Calculations: Enjoy automatic updates for DCF, Net Present Value (NPV), and cash flow assessments.
- User-Friendly Dashboard: Utilize clear charts and summaries to effectively visualize your valuation outcomes.
- Designed for All Skill Levels: An intuitive layout suitable for investors, CFOs, and consultants alike.
How It Works
- Download the Template: Gain immediate access to the Excel-based AFRM DCF Calculator.
- Input Your Assumptions: Modify the yellow-highlighted cells for growth rates, WACC, margins, and other parameters.
- Instant Calculations: The model will automatically refresh Affirm's intrinsic value.
- Test Scenarios: Experiment with various assumptions to assess potential valuation impacts.
- Analyze and Decide: Leverage the findings to inform your investment or financial evaluations.
Why Choose This Calculator for Affirm Holdings, Inc. (AFRM)?
- Accuracy: Utilizes real Affirm financial data for precise calculations.
- Flexibility: Tailored for users to easily adjust and experiment with inputs.
- Time-Saving: Avoid the complexities of constructing a financial model from the ground up.
- Professional-Grade: Crafted with the expertise and standards expected by CFOs.
- User-Friendly: Intuitive interface designed for users of all financial backgrounds.
Who Should Use This Product?
- Finance Students: Discover innovative financing models and apply them using real-world data.
- Academics: Integrate advanced financial theories into your research or educational programs.
- Investors: Evaluate your investment strategies and analyze valuation outcomes for Affirm Holdings, Inc. (AFRM).
- Analysts: Enhance your analysis process with a customizable financial modeling tool.
- Small Business Owners: Understand how fintech companies like Affirm are valued and assessed in the market.
What the Template Contains
- Preloaded AFRM Data: Historical and projected financial data, including revenue, EBIT, and capital expenditures.
- DCF and WACC Models: Professional-grade sheets for calculating intrinsic value and Weighted Average Cost of Capital.
- Editable Inputs: Yellow-highlighted cells for adjusting revenue growth, tax rates, and discount rates.
- Financial Statements: Comprehensive annual and quarterly financials for deeper analysis.
- Key Ratios: Profitability, leverage, and efficiency ratios to evaluate performance.
- Dashboard and Charts: Visual summaries of valuation outcomes and assumptions.
Disclaimer
All information, articles, and product details provided on this website are for general informational and educational purposes only. We do not claim any ownership over, nor do we intend to infringe upon, any trademarks, copyrights, logos, brand names, or other intellectual property mentioned or depicted on this site. Such intellectual property remains the property of its respective owners, and any references here are made solely for identification or informational purposes, without implying any affiliation, endorsement, or partnership.
We make no representations or warranties, express or implied, regarding the accuracy, completeness, or suitability of any content or products presented. Nothing on this website should be construed as legal, tax, investment, financial, medical, or other professional advice. In addition, no part of this site—including articles or product references—constitutes a solicitation, recommendation, endorsement, advertisement, or offer to buy or sell any securities, franchises, or other financial instruments, particularly in jurisdictions where such activity would be unlawful.
All content is of a general nature and may not address the specific circumstances of any individual or entity. It is not a substitute for professional advice or services. Any actions you take based on the information provided here are strictly at your own risk. You accept full responsibility for any decisions or outcomes arising from your use of this website and agree to release us from any liability in connection with your use of, or reliance upon, the content or products found herein.