
|
Akzo Nobel N.V. (Akza.as) DCF -Bewertung |
Fully Editable: Tailor To Your Needs In Excel Or Sheets
Professional Design: Trusted, Industry-Standard Templates
Investor-Approved Valuation Models
MAC/PC Compatible, Fully Unlocked
No Expertise Is Needed; Easy To Follow
Akzo Nobel N.V. (AKZA.AS) Bundle
Bewerten Sie die finanzielle Aussichten von Akzo Nobel N. V. mit Expertenpräzision! Dieser (AKZAAS) DCF-Taschenrechner ist mit vorgefüllten Finanzdaten sowie die Flexibilität, das Umsatzwachstum, WACC, Margen und andere wichtige Annahmen zu ändern, um sich an Ihren Projektionen auszurichten.
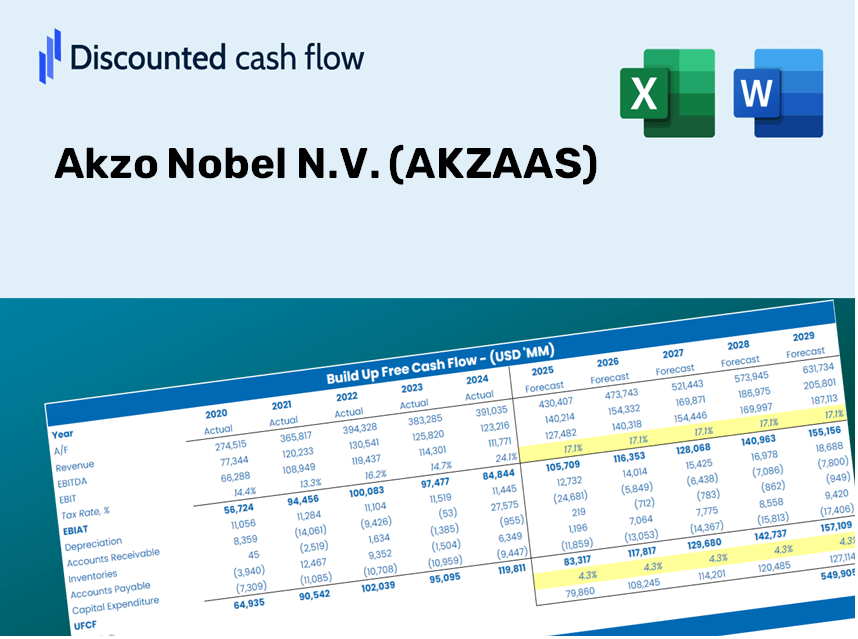
Discounted Cash Flow (DCF) - (USD MM)
| Year | AY1 2020 |
AY2 2021 |
AY3 2022 |
AY4 2023 |
AY5 2024 |
FY1 2025 |
FY2 2026 |
FY3 2027 |
FY4 2028 |
FY5 2029 |
|---|---|---|---|---|---|---|---|---|---|---|
| Revenue | 8,530.0 | 9,587.0 | 10,846.0 | 10,668.0 | 10,711.0 | 11,361.3 | 12,051.1 | 12,782.8 | 13,558.9 | 14,382.1 |
| Revenue Growth, % | 0 | 12.39 | 13.13 | -1.64 | 0.40307 | 6.07 | 6.07 | 6.07 | 6.07 | 6.07 |
| EBITDA | 1,327.0 | 1,530.0 | 1,052.0 | 1,413.0 | 1,399.0 | 1,534.3 | 1,627.4 | 1,726.2 | 1,831.0 | 1,942.2 |
| EBITDA, % | 15.56 | 15.96 | 9.7 | 13.25 | 13.06 | 13.5 | 13.5 | 13.5 | 13.5 | 13.5 |
| Depreciation | 364.0 | 351.0 | 362.0 | 355.0 | 371.0 | 410.3 | 435.2 | 461.7 | 489.7 | 519.4 |
| Depreciation, % | 4.27 | 3.66 | 3.34 | 3.33 | 3.46 | 3.61 | 3.61 | 3.61 | 3.61 | 3.61 |
| EBIT | 963.0 | 1,179.0 | 690.0 | 1,058.0 | 1,028.0 | 1,124.0 | 1,192.2 | 1,264.6 | 1,341.4 | 1,422.8 |
| EBIT, % | 11.29 | 12.3 | 6.36 | 9.92 | 9.6 | 9.89 | 9.89 | 9.89 | 9.89 | 9.89 |
| Total Cash | 1,856.0 | 1,210.0 | 1,786.0 | 1,778.0 | 1,467.0 | 1,845.3 | 1,957.3 | 2,076.2 | 2,202.2 | 2,335.9 |
| Total Cash, percent | .0 | .0 | .0 | .0 | .0 | .0 | .0 | .0 | .0 | .0 |
| Account Receivables | 1,863.0 | 2,142.0 | 2,215.0 | 2,187.0 | 2,273.0 | 2,416.0 | 2,562.7 | 2,718.3 | 2,883.4 | 3,058.4 |
| Account Receivables, % | 21.84 | 22.34 | 20.42 | 20.5 | 21.22 | 21.27 | 21.27 | 21.27 | 21.27 | 21.27 |
| Inventories | 1,159.0 | 1,650.0 | 1,843.0 | 1,649.0 | 1,721.0 | 1,802.3 | 1,911.7 | 2,027.7 | 2,150.9 | 2,281.5 |
| Inventories, % | 13.59 | 17.21 | 16.99 | 15.46 | 16.07 | 15.86 | 15.86 | 15.86 | 15.86 | 15.86 |
| Accounts Payable | 1,163.0 | 1,483.0 | 2,206.0 | 2,312.0 | 2,740.0 | 2,197.2 | 2,330.6 | 2,472.1 | 2,622.2 | 2,781.4 |
| Accounts Payable, % | 13.63 | 15.47 | 20.34 | 21.67 | 25.58 | 19.34 | 19.34 | 19.34 | 19.34 | 19.34 |
| Capital Expenditure | -258.0 | -288.0 | -292.0 | -286.0 | -306.0 | -324.0 | -343.7 | -364.5 | -386.7 | -410.1 |
| Capital Expenditure, % | -3.02 | -3 | -2.69 | -2.68 | -2.86 | -2.85 | -2.85 | -2.85 | -2.85 | -2.85 |
| Tax Rate, % | 35.32 | 35.32 | 35.32 | 35.32 | 35.32 | 35.32 | 35.32 | 35.32 | 35.32 | 35.32 |
| EBITAT | 660.2 | 884.5 | 403.5 | 596.5 | 664.9 | 726.3 | 770.4 | 817.2 | 866.8 | 919.4 |
| Depreciation | ||||||||||
| Changes in Account Receivables | ||||||||||
| Changes in Inventories | ||||||||||
| Changes in Accounts Payable | ||||||||||
| Capital Expenditure | ||||||||||
| UFCF | -1,092.8 | 497.5 | 930.5 | 993.5 | 999.9 | 45.5 | 739.3 | 784.1 | 831.7 | 882.2 |
| WACC, % | 6.8 | 6.89 | 6.67 | 6.64 | 6.75 | 6.75 | 6.75 | 6.75 | 6.75 | 6.75 |
| PV UFCF | ||||||||||
| SUM PV UFCF | 2,613.1 | |||||||||
| Long Term Growth Rate, % | 2.00 | |||||||||
| Free cash flow (T + 1) | 900 | |||||||||
| Terminal Value | 18,957 | |||||||||
| Present Terminal Value | 13,677 | |||||||||
| Enterprise Value | 16,290 | |||||||||
| Net Debt | 4,066 | |||||||||
| Equity Value | 12,224 | |||||||||
| Diluted Shares Outstanding, MM | 172 | |||||||||
| Equity Value Per Share | 71.27 |
What Awaits You
- Pre-Loaded Financial Model: Utilize Akzo Nobel N.V.’s real data for accurate DCF valuation.
- Comprehensive Forecast Control: Modify revenue growth, profit margins, WACC, and other essential variables.
- Immediate Calculations: Real-time updates allow you to see outcomes as you adjust inputs.
- Professionally-Designed Template: An expertly crafted Excel file ready for investor presentations.
- Flexible and Reusable: Designed for adaptability, enabling repeated use for thorough forecasting.
Core Highlights
- Accurate Akzo Nobel Financials: Gain access to reliable pre-loaded historical figures and future forecasts.
- Personalizable Forecast Assumptions: Modify the yellow-highlighted cells to adjust WACC, growth rates, and margins.
- Real-Time Calculations: Automatic recalculations for DCF, Net Present Value (NPV), and cash flow analysis.
- Interactive Dashboard: User-friendly charts and summaries to help you visualize valuation outcomes.
- Designed for All Users: A clear and intuitive layout created for investors, CFOs, and consultants alike.
How It Works
- Download: Obtain the pre-configured Excel file containing Akzo Nobel N.V.'s (AKZAAS) financial data.
- Customize: Modify forecasts such as revenue growth, EBITDA %, and WACC as per your analysis.
- Update Automatically: Intrinsic value and NPV calculations refresh in real-time.
- Test Scenarios: Generate various projections and instantly compare the results.
- Make Decisions: Leverage the valuation results to inform your investment strategies.
Why Choose This Calculator for Akzo Nobel N.V. (AKZAAS)?
- Accuracy: Utilizes real Akzo Nobel financial data for precise calculations.
- Flexibility: Tailored for users to customize and experiment with various inputs effortlessly.
- Time-Saving: Eliminate the need to create a DCF model from the ground up.
- Professional-Grade: Crafted with the same level of detail and usability expected by CFOs.
- User-Friendly: Intuitive interface suitable for users with any level of financial modeling experience.
Who Can Benefit from Akzo Nobel N.V. (AKZAAS) Products?
- Investors: Utilize our advanced valuation tools to make informed investment choices.
- Financial Analysts: Streamline your workflow with a ready-to-customize DCF model.
- Consultants: Efficiently tailor presentations or reports using our adaptable templates.
- Finance Enthusiasts: Enhance your knowledge of valuation methodologies through practical examples.
- Educators and Students: Employ our resources as effective learning aids in finance curricula.
Contents of the Template
- Comprehensive DCF Model: An editable template featuring detailed valuation calculations.
- Real-World Data: Historical and projected financials for Akzo Nobel N.V. (AKZAAS) preloaded for in-depth analysis.
- Customizable Parameters: Modify WACC, growth rates, and tax assumptions to explore different scenarios.
- Financial Statements: Complete annual and quarterly breakdowns for enhanced insights.
- Key Ratios: Integrated analysis covering profitability, efficiency, and leverage metrics.
- Dashboard with Visual Outputs: Graphs and tables deliver clear, actionable insights.
Disclaimer
All information, articles, and product details provided on this website are for general informational and educational purposes only. We do not claim any ownership over, nor do we intend to infringe upon, any trademarks, copyrights, logos, brand names, or other intellectual property mentioned or depicted on this site. Such intellectual property remains the property of its respective owners, and any references here are made solely for identification or informational purposes, without implying any affiliation, endorsement, or partnership.
We make no representations or warranties, express or implied, regarding the accuracy, completeness, or suitability of any content or products presented. Nothing on this website should be construed as legal, tax, investment, financial, medical, or other professional advice. In addition, no part of this site—including articles or product references—constitutes a solicitation, recommendation, endorsement, advertisement, or offer to buy or sell any securities, franchises, or other financial instruments, particularly in jurisdictions where such activity would be unlawful.
All content is of a general nature and may not address the specific circumstances of any individual or entity. It is not a substitute for professional advice or services. Any actions you take based on the information provided here are strictly at your own risk. You accept full responsibility for any decisions or outcomes arising from your use of this website and agree to release us from any liability in connection with your use of, or reliance upon, the content or products found herein.