
|
Aldeyra Therapeutics, Inc. (ALDX) DCF -Bewertung |
Fully Editable: Tailor To Your Needs In Excel Or Sheets
Professional Design: Trusted, Industry-Standard Templates
Investor-Approved Valuation Models
MAC/PC Compatible, Fully Unlocked
No Expertise Is Needed; Easy To Follow
Aldeyra Therapeutics, Inc. (ALDX) Bundle
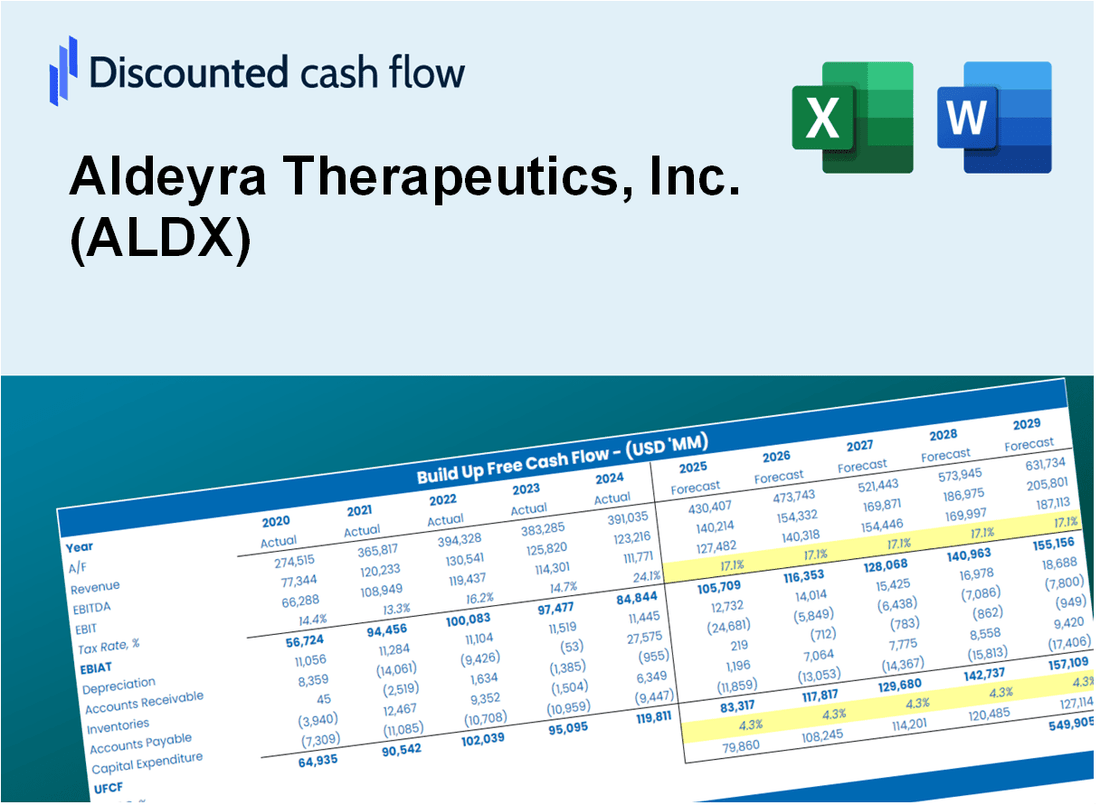
Unser (ALDX) DCF-Taschenrechner für Genauigkeit entwickelt und ermöglicht es Ihnen, die Bewertung von Aldeyra Therapeutics, Inc. unter Verwendung aktueller Finanzinformationen zu bewerten und bietet vollständige Flexibilität, um alle wesentlichen Parameter für erweiterte Projektionen zu ändern.
What You Will Get
- Editable Forecast Inputs: Effortlessly modify key assumptions (growth %, margins, WACC) to explore various scenarios.
- Real-World Data: Aldeyra Therapeutics, Inc. (ALDX) financial data pre-filled to enhance your analysis.
- Automatic DCF Outputs: The template automatically calculates Net Present Value (NPV) and intrinsic value for your convenience.
- Customizable and Professional: A refined Excel model that adjusts to meet your valuation requirements.
- Built for Analysts and Investors: Perfect for evaluating projections, confirming strategies, and optimizing your time.
Key Features
- Comprehensive Data: Aldeyra Therapeutics’ historical financial statements and pre-filled projections.
- Customizable Inputs: Modify WACC, tax rates, revenue growth, and EBITDA margins to fit your analysis.
- Real-Time Calculations: Observe Aldeyra Therapeutics’ intrinsic value update instantly.
- Intuitive Visuals: Dashboard graphs showcase valuation results and essential metrics.
- Designed for Precision: A reliable tool for analysts, investors, and finance professionals.
How It Works
- Step 1: Download the prebuilt Excel template featuring Aldeyra Therapeutics, Inc. (ALDX) data.
- Step 2: Review the pre-filled sheets to familiarize yourself with the essential metrics.
- Step 3: Modify forecasts and assumptions in the editable yellow cells (WACC, growth, margins).
- Step 4: Instantly see recalculated results, including Aldeyra Therapeutics, Inc. (ALDX)'s intrinsic value.
- Step 5: Make well-informed investment decisions or create reports based on the outputs.
Why Choose This Calculator for Aldeyra Therapeutics, Inc. (ALDX)?
- Accurate Data: Utilize real Aldeyra financials for dependable valuation outcomes.
- Customizable: Tailor essential parameters such as growth rates, WACC, and tax rates to align with your forecasts.
- Time-Saving: Pre-configured calculations save you from having to start from the ground up.
- Professional-Grade Tool: Crafted for investors, analysts, and consultants in the biotech sector.
- User-Friendly: An intuitive interface with clear, step-by-step guidance makes it accessible for everyone.
Who Should Use This Product?
- Investors: Evaluate Aldeyra Therapeutics’ valuation before making investment decisions.
- CFOs and Financial Analysts: Optimize valuation methodologies and assess financial forecasts.
- Startup Founders: Understand how biotech companies like Aldeyra Therapeutics are appraised.
- Consultants: Provide detailed valuation analyses and reports for clients in the biotech sector.
- Students and Educators: Utilize real-time data to learn and teach valuation practices in biotechnology.
What the Aldeyra Therapeutics, Inc. (ALDX) Template Contains
- Comprehensive DCF Model: Editable template with detailed valuation calculations tailored for Aldeyra Therapeutics.
- Real-World Data: Aldeyra’s historical and projected financials preloaded for in-depth analysis.
- Customizable Parameters: Adjust WACC, growth rates, and tax assumptions to explore various scenarios.
- Financial Statements: Complete annual and quarterly breakdowns for enhanced insights.
- Key Ratios: Integrated analysis for profitability, efficiency, and leverage specific to Aldeyra.
- Dashboard with Visual Outputs: Charts and tables providing clear, actionable results for stakeholders.
Disclaimer
All information, articles, and product details provided on this website are for general informational and educational purposes only. We do not claim any ownership over, nor do we intend to infringe upon, any trademarks, copyrights, logos, brand names, or other intellectual property mentioned or depicted on this site. Such intellectual property remains the property of its respective owners, and any references here are made solely for identification or informational purposes, without implying any affiliation, endorsement, or partnership.
We make no representations or warranties, express or implied, regarding the accuracy, completeness, or suitability of any content or products presented. Nothing on this website should be construed as legal, tax, investment, financial, medical, or other professional advice. In addition, no part of this site—including articles or product references—constitutes a solicitation, recommendation, endorsement, advertisement, or offer to buy or sell any securities, franchises, or other financial instruments, particularly in jurisdictions where such activity would be unlawful.
All content is of a general nature and may not address the specific circumstances of any individual or entity. It is not a substitute for professional advice or services. Any actions you take based on the information provided here are strictly at your own risk. You accept full responsibility for any decisions or outcomes arising from your use of this website and agree to release us from any liability in connection with your use of, or reliance upon, the content or products found herein.