
|
Applied Materials, Inc. (AMAT) DCF -Bewertung |
Fully Editable: Tailor To Your Needs In Excel Or Sheets
Professional Design: Trusted, Industry-Standard Templates
Investor-Approved Valuation Models
MAC/PC Compatible, Fully Unlocked
No Expertise Is Needed; Easy To Follow
Applied Materials, Inc. (AMAT) Bundle
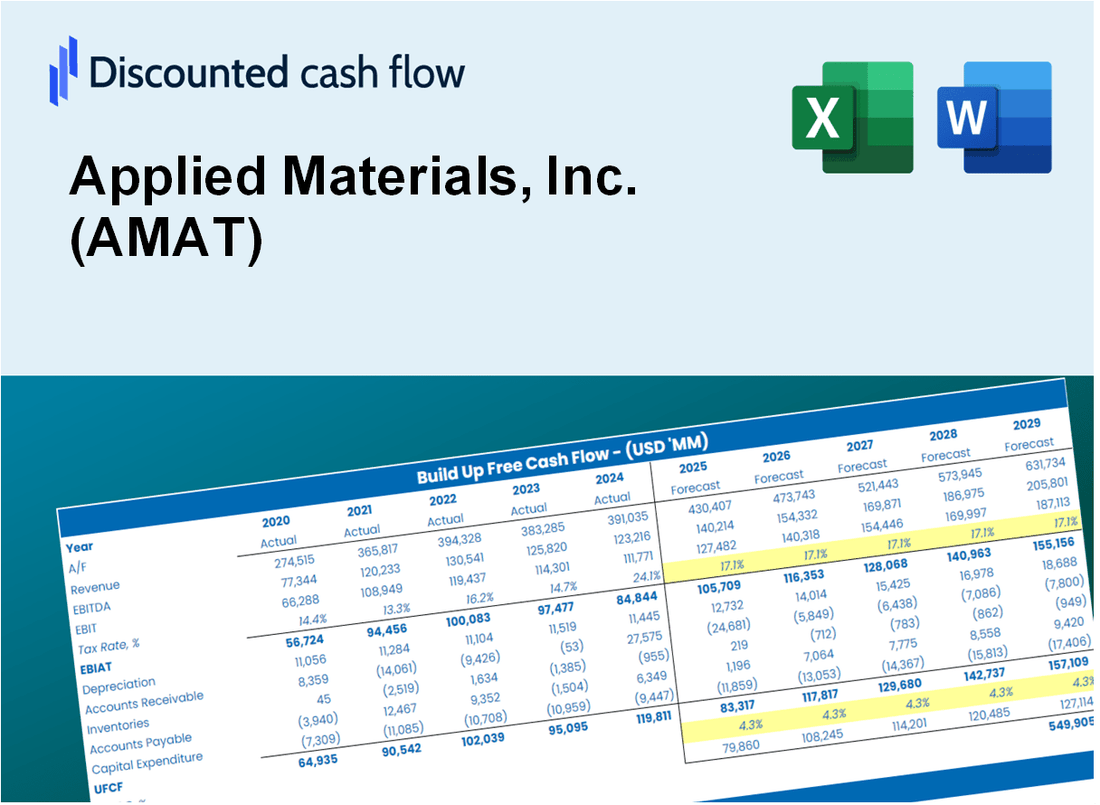
Gewinnen Sie einen Einblick in Ihre Bewertungsanalyse für Applied Materials, Inc. (AMAT) mit unserem ausgefeilten DCF -Taschenrechner! Diese Excel -Vorlage mit realen AMAT -Daten ermöglicht es Ihnen, Prognosen und Annahmen anzupassen, um den inneren Wert von Applied Materials, Inc. (AMAT) genau zu berechnen.
What You Will Get
- Editable Excel Template: A fully customizable Excel-based DCF Calculator featuring pre-filled real AMAT financials.
- Real-World Data: Historical data and forward-looking estimates (as displayed in the highlighted cells).
- Forecast Flexibility: Adjust forecast assumptions such as revenue growth, EBITDA %, and WACC.
- Automatic Calculations: Instantly observe how your inputs affect Applied Materials’ valuation.
- Professional Tool: Designed for investors, CFOs, consultants, and financial analysts.
- User-Friendly Design: Organized for clarity and ease of use, complete with step-by-step instructions.
Key Features
- 🔍 Real-Life AMAT Financials: Pre-filled historical and projected data for Applied Materials, Inc. (AMAT).
- ✏️ Fully Customizable Inputs: Adjust all critical parameters (yellow cells) like WACC, growth %, and tax rates.
- 📊 Professional DCF Valuation: Built-in formulas calculate Applied Materials’ intrinsic value using the Discounted Cash Flow method.
- ⚡ Instant Results: Visualize Applied Materials’ valuation instantly after making changes.
- Scenario Analysis: Test and compare outcomes for various financial assumptions side-by-side.
How It Works
- Step 1: Download the prebuilt Excel template featuring Applied Materials, Inc. (AMAT) data.
- Step 2: Navigate through the pre-filled sheets to grasp the essential metrics.
- Step 3: Adjust forecasts and assumptions in the editable yellow cells (WACC, growth, margins).
- Step 4: Instantly see recalibrated results, including Applied Materials, Inc. (AMAT)'s intrinsic value.
- Step 5: Make well-informed investment choices or create reports based on the outputs.
Why Choose Applied Materials, Inc. (AMAT)?
- Innovative Solutions: Cutting-edge technology that drives advancements in semiconductor manufacturing.
- Proven Reliability: Trusted by industry leaders for consistent performance and quality.
- Comprehensive Support: Extensive resources and expertise to assist customers at every stage.
- Global Reach: A strong presence in key markets worldwide, ensuring accessibility and service.
- Commitment to Sustainability: Focused on environmentally friendly practices and reducing waste.
Who Should Use This Product?
- Investors: Accurately estimate Applied Materials, Inc.'s (AMAT) fair value before making investment decisions.
- CFOs: Leverage a professional-grade DCF model for financial reporting and analysis specific to Applied Materials, Inc. (AMAT).
- Consultants: Quickly adapt the template for valuation reports tailored to clients interested in Applied Materials, Inc. (AMAT).
- Entrepreneurs: Gain insights into financial modeling techniques used by leading companies like Applied Materials, Inc. (AMAT).
- Educators: Use it as a teaching tool to demonstrate valuation methodologies relevant to Applied Materials, Inc. (AMAT).
What the Template Contains
- Preloaded AMAT Data: Historical and projected financial data, including revenue, EBIT, and capital expenditures.
- DCF and WACC Models: Professional-grade sheets for calculating intrinsic value and Weighted Average Cost of Capital.
- Editable Inputs: Yellow-highlighted cells for adjusting revenue growth, tax rates, and discount rates.
- Financial Statements: Comprehensive annual and quarterly financials for deeper analysis.
- Key Ratios: Profitability, leverage, and efficiency ratios to evaluate performance.
- Dashboard and Charts: Visual summaries of valuation outcomes and assumptions.
Disclaimer
All information, articles, and product details provided on this website are for general informational and educational purposes only. We do not claim any ownership over, nor do we intend to infringe upon, any trademarks, copyrights, logos, brand names, or other intellectual property mentioned or depicted on this site. Such intellectual property remains the property of its respective owners, and any references here are made solely for identification or informational purposes, without implying any affiliation, endorsement, or partnership.
We make no representations or warranties, express or implied, regarding the accuracy, completeness, or suitability of any content or products presented. Nothing on this website should be construed as legal, tax, investment, financial, medical, or other professional advice. In addition, no part of this site—including articles or product references—constitutes a solicitation, recommendation, endorsement, advertisement, or offer to buy or sell any securities, franchises, or other financial instruments, particularly in jurisdictions where such activity would be unlawful.
All content is of a general nature and may not address the specific circumstances of any individual or entity. It is not a substitute for professional advice or services. Any actions you take based on the information provided here are strictly at your own risk. You accept full responsibility for any decisions or outcomes arising from your use of this website and agree to release us from any liability in connection with your use of, or reliance upon, the content or products found herein.