
|
DCF -Bewertung der American Well Corporation (AMWL) |
Fully Editable: Tailor To Your Needs In Excel Or Sheets
Professional Design: Trusted, Industry-Standard Templates
Investor-Approved Valuation Models
MAC/PC Compatible, Fully Unlocked
No Expertise Is Needed; Easy To Follow
American Well Corporation (AMWL) Bundle
Entdecken Sie das wahre Potenzial der American Well Corporation mit unserem DCF-Taschenrechner von Professional Grade! Passen Sie die wichtigsten Annahmen an, erkunden Sie verschiedene Szenarien und bewerten Sie, wie sich Änderungen auf die Bewertung der American Well Corporation auswirken - alles innerhalb einer einzigen Excel -Vorlage.
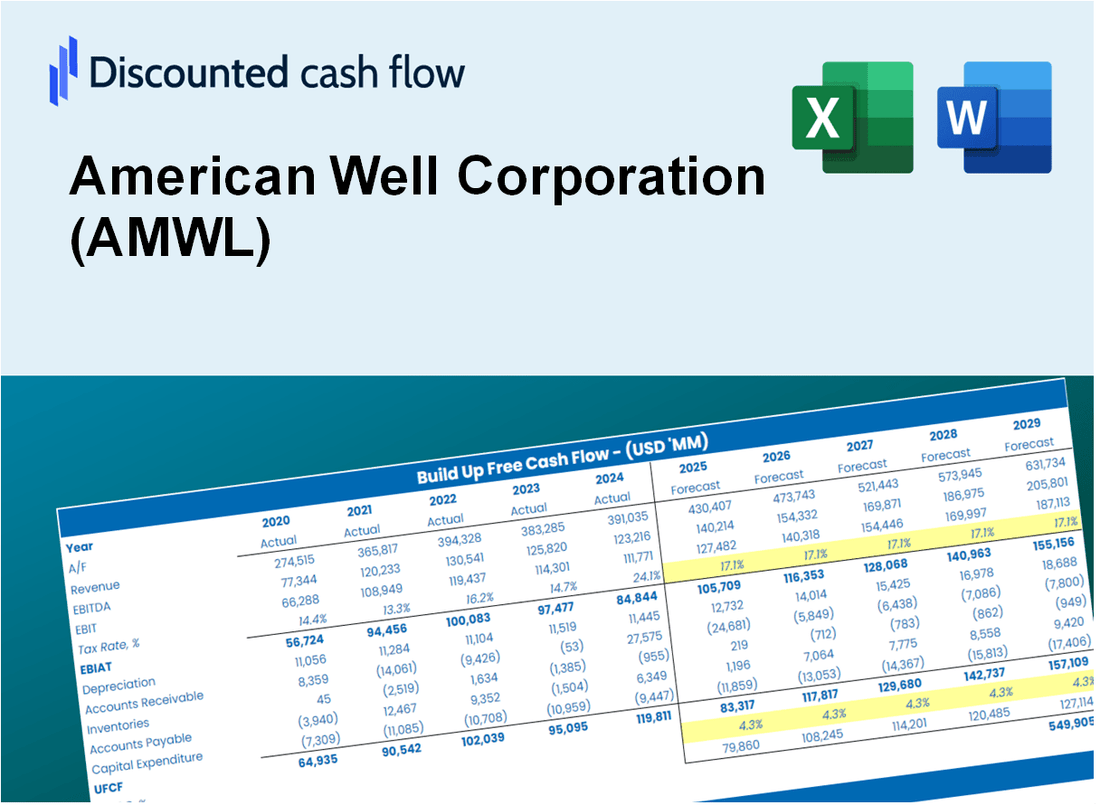
Discounted Cash Flow (DCF) - (USD MM)
| Year | AY1 2020 |
AY2 2021 |
AY3 2022 |
AY4 2023 |
AY5 2024 |
FY1 2025 |
FY2 2026 |
FY3 2027 |
FY4 2028 |
FY5 2029 |
|---|---|---|---|---|---|---|---|---|---|---|
| Revenue | 245.3 | 252.8 | 277.2 | 259.0 | 254.4 | 257.1 | 259.9 | 262.8 | 265.7 | 268.6 |
| Revenue Growth, % | 0 | 3.07 | 9.65 | -6.55 | -1.81 | 1.09 | 1.09 | 1.09 | 1.09 | 1.09 |
| EBITDA | -214.8 | -162.2 | -243.0 | -640.8 | -173.3 | -209.6 | -211.9 | -214.2 | -216.5 | -218.9 |
| EBITDA, % | -87.58 | -64.16 | -87.65 | -247.37 | -68.15 | -81.51 | -81.51 | -81.51 | -81.51 | -81.51 |
| Depreciation | 11.0 | 16.8 | 26.8 | 31.9 | 33.4 | 23.8 | 24.1 | 24.3 | 24.6 | 24.9 |
| Depreciation, % | 4.49 | 6.66 | 9.66 | 12.32 | 13.14 | 9.25 | 9.25 | 9.25 | 9.25 | 9.25 |
| EBIT | -225.8 | -179.0 | -269.7 | -672.7 | -206.8 | -227.0 | -229.5 | -232.0 | -234.6 | -237.1 |
| EBIT, % | -92.06 | -70.82 | -97.31 | -259.69 | -81.29 | -88.3 | -88.3 | -88.3 | -88.3 | -88.3 |
| Total Cash | 1,041.6 | 746.4 | 538.5 | 372.0 | 228.3 | 251.9 | 254.6 | 257.4 | 260.2 | 263.1 |
| Total Cash, percent | .0 | .0 | .0 | .0 | .0 | .0 | .0 | .0 | .0 | .0 |
| Account Receivables | 45.3 | 51.4 | 58.4 | 54.1 | 71.9 | 56.1 | 56.7 | 57.3 | 57.9 | 58.6 |
| Account Receivables, % | 18.47 | 20.32 | 21.06 | 20.9 | 28.26 | 21.8 | 21.8 | 21.8 | 21.8 | 21.8 |
| Inventories | 9.1 | 7.5 | 8.7 | 6.7 | 2.9 | 7.0 | 7.0 | 7.1 | 7.2 | 7.3 |
| Inventories, % | 3.72 | 2.98 | 3.15 | 2.57 | 1.12 | 2.71 | 2.71 | 2.71 | 2.71 | 2.71 |
| Accounts Payable | 5.8 | 12.2 | 7.2 | 4.9 | 5.0 | 7.0 | 7.1 | 7.2 | 7.2 | 7.3 |
| Accounts Payable, % | 2.36 | 4.81 | 2.61 | 1.88 | 1.97 | 2.73 | 2.73 | 2.73 | 2.73 | 2.73 |
| Capital Expenditure | -3.3 | -.6 | -10.4 | -15.2 | -15.2 | -8.9 | -8.9 | -9.0 | -9.1 | -9.2 |
| Capital Expenditure, % | -1.35 | -0.22113 | -3.77 | -5.89 | -5.98 | -3.44 | -3.44 | -3.44 | -3.44 | -3.44 |
| Tax Rate, % | 0.83092 | 0.83092 | 0.83092 | 0.83092 | 0.83092 | 0.83092 | 0.83092 | 0.83092 | 0.83092 | 0.83092 |
| EBITAT | -222.3 | -173.3 | -268.2 | -672.6 | -205.1 | -224.2 | -226.7 | -229.2 | -231.7 | -234.2 |
| Depreciation | ||||||||||
| Changes in Account Receivables | ||||||||||
| Changes in Inventories | ||||||||||
| Changes in Accounts Payable | ||||||||||
| Capital Expenditure | ||||||||||
| UFCF | -263.2 | -155.2 | -265.0 | -652.0 | -200.6 | -195.6 | -212.2 | -214.5 | -216.8 | -219.2 |
| WACC, % | 9.05 | 9.04 | 9.06 | 9.06 | 9.06 | 9.05 | 9.05 | 9.05 | 9.05 | 9.05 |
| PV UFCF | ||||||||||
| SUM PV UFCF | -818.6 | |||||||||
| Long Term Growth Rate, % | 2.00 | |||||||||
| Free cash flow (T + 1) | -224 | |||||||||
| Terminal Value | -3,170 | |||||||||
| Present Terminal Value | -2,055 | |||||||||
| Enterprise Value | -2,874 | |||||||||
| Net Debt | -220 | |||||||||
| Equity Value | -2,654 | |||||||||
| Diluted Shares Outstanding, MM | 15 | |||||||||
| Equity Value Per Share | -176.92 |
What You Will Receive
- Customizable Excel Template: A fully adaptable Excel-based DCF Calculator featuring pre-filled financials for AMWL (American Well Corporation).
- Real-Time Data: Historical performance metrics and forward-looking projections (highlighted in the yellow cells).
- Forecasting Options: Adjust key assumptions such as revenue growth, EBITDA %, and WACC to fit your analysis.
- Instant Calculations: Quickly observe how your inputs affect the valuation of American Well Corporation.
- Professional Resource: Designed for investors, CFOs, consultants, and financial analysts alike.
- User-Centric Layout: Organized for clarity and simplicity, complete with step-by-step guidance.
Key Features
- Comprehensive Data: American Well Corporation’s (AMWL) historical financial reports and pre-filled projections.
- Customizable Inputs: Modify WACC, tax rates, revenue growth, and EBITDA margins as needed.
- Real-Time Results: Observe American Well Corporation’s intrinsic value update instantly.
- Intuitive Visual Outputs: Dashboard graphs illustrate valuation outcomes and essential metrics.
- Designed for Precision: A professional-grade tool for analysts, investors, and financial professionals.
How It Works
- 1. Access the Template: Download and open the Excel file featuring American Well Corporation’s (AMWL) preloaded data.
- 2. Modify Assumptions: Adjust key parameters such as growth projections, WACC, and capital expenditures.
- 3. Analyze Results Instantly: The DCF model automatically computes intrinsic value and NPV based on your inputs.
- 4. Explore Scenarios: Evaluate various forecasts to understand different valuation possibilities.
- 5. Present with Assurance: Share expert valuation insights to bolster your decision-making process.
Why Choose This Calculator for American Well Corporation (AMWL)?
- All-in-One Solution: Combines DCF, WACC, and financial ratio analyses tailored for AMWL.
- Flexible Inputs: Modify the highlighted cells to explore different financial scenarios.
- In-Depth Analysis: Automatically computes American Well's intrinsic value and Net Present Value.
- Preloaded Information: Historical and projected data provide reliable baselines for analysis.
- High-Quality Standards: Perfect for financial analysts, investors, and business advisors focusing on AMWL.
Who Should Use This Product?
- Investors: Accurately assess American Well Corporation’s (AMWL) fair value before making investment choices.
- CFOs: Utilize a professional-grade DCF model for financial reporting and analysis specific to American Well Corporation.
- Consultants: Efficiently customize the template for valuation reports tailored to clients involving American Well Corporation.
- Entrepreneurs: Acquire insights into financial modeling practices adopted by leading healthcare companies.
- Educators: Employ it as a teaching resource to illustrate valuation methodologies in the healthcare sector.
What the Template Contains
- Pre-Filled Data: Includes American Well Corporation’s historical financials and forecasts.
- Discounted Cash Flow Model: Editable DCF valuation model with automatic calculations.
- Weighted Average Cost of Capital (WACC): A dedicated sheet for calculating WACC based on custom inputs.
- Key Financial Ratios: Analyze American Well Corporation’s profitability, efficiency, and leverage.
- Customizable Inputs: Edit revenue growth, margins, and tax rates with ease.
- Clear Dashboard: Charts and tables summarizing key valuation results.
Disclaimer
All information, articles, and product details provided on this website are for general informational and educational purposes only. We do not claim any ownership over, nor do we intend to infringe upon, any trademarks, copyrights, logos, brand names, or other intellectual property mentioned or depicted on this site. Such intellectual property remains the property of its respective owners, and any references here are made solely for identification or informational purposes, without implying any affiliation, endorsement, or partnership.
We make no representations or warranties, express or implied, regarding the accuracy, completeness, or suitability of any content or products presented. Nothing on this website should be construed as legal, tax, investment, financial, medical, or other professional advice. In addition, no part of this site—including articles or product references—constitutes a solicitation, recommendation, endorsement, advertisement, or offer to buy or sell any securities, franchises, or other financial instruments, particularly in jurisdictions where such activity would be unlawful.
All content is of a general nature and may not address the specific circumstances of any individual or entity. It is not a substitute for professional advice or services. Any actions you take based on the information provided here are strictly at your own risk. You accept full responsibility for any decisions or outcomes arising from your use of this website and agree to release us from any liability in connection with your use of, or reliance upon, the content or products found herein.