
|
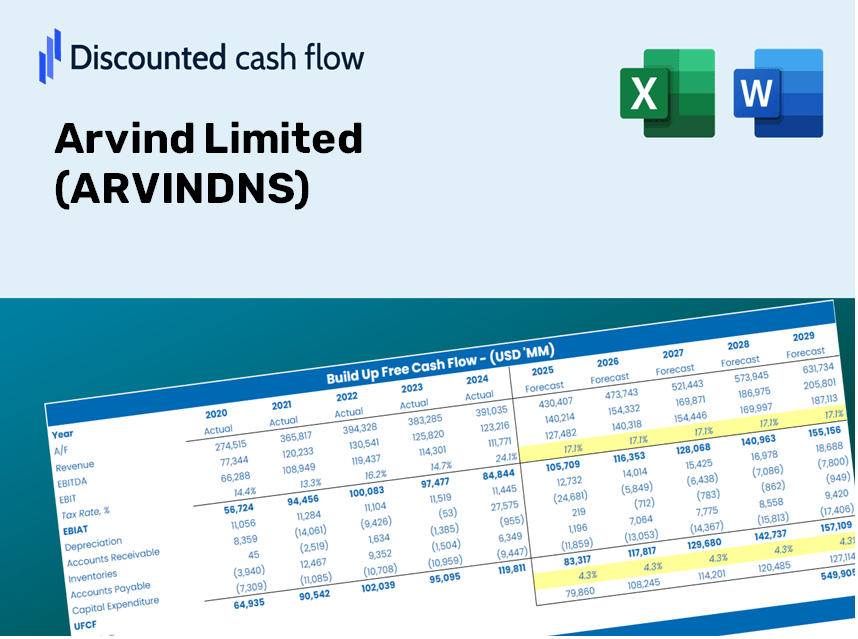
ARVIND LIMITED (ARVIND.NS) DCF -Bewertung |
Fully Editable: Tailor To Your Needs In Excel Or Sheets
Professional Design: Trusted, Industry-Standard Templates
Investor-Approved Valuation Models
MAC/PC Compatible, Fully Unlocked
No Expertise Is Needed; Easy To Follow
Arvind Limited (ARVIND.NS) Bundle
Bewerten Sie die finanziellen Aussichten von Arvind Limited wie ein Experte! Dieser Arvindns DCF-Taschenrechner bietet vorgefüllte Finanzdaten zusammen mit der Vielseitigkeit, um das Umsatzwachstum, WACC, Margen und andere wesentliche Annahmen zu ändern, um sich an Ihren Projektionen zu übereinstimmen.
What You Will Receive
- Adjustable Forecast Inputs: Effortlessly modify key assumptions (growth %, margins, WACC) to explore various scenarios.
- Comprehensive Data: Arvind Limited’s financial information pre-loaded to enhance your analysis.
- Automated DCF Outputs: The template computes Net Present Value (NPV) and intrinsic value automatically.
- Tailorable and Professional: A refined Excel model designed to meet your valuation requirements.
- Designed for Analysts and Investors: Perfect for evaluating projections, validating strategies, and streamlining your workflow.
Key Features
- Authentic Arvind Financial Data: Gain access to reliable pre-loaded historical figures and future forecasts.
- Adjustable Forecast Parameters: Modify yellow-highlighted fields such as WACC, growth rates, and profit margins.
- Real-Time Calculations: Automatic updates for DCF, Net Present Value (NPV), and cash flow assessments.
- Interactive Dashboard: User-friendly charts and summaries for a clear view of your valuation outcomes.
- Ideal for All Experience Levels: A straightforward, intuitive design tailored for investors, CFOs, and consultants alike.
How It Works
- Download: Obtain the pre-configured Excel file containing Arvind Limited's (ARVINDNS) financial data.
- Customize: Modify forecasts such as revenue growth, EBITDA percentage, and WACC.
- Update Automatically: Watch as the intrinsic value and NPV calculations refresh in real-time.
- Test Scenarios: Generate various projections and compare results instantly.
- Make Decisions: Leverage the valuation outcomes to inform your investment approach.
Why Opt for This Calculator for Arvind Limited (ARVINDNS)?
- All-in-One Solution: Incorporates DCF, WACC, and financial ratio analyses within a single tool.
- Flexible Inputs: Modify the yellow-highlighted cells to explore different financial scenarios.
- In-Depth Analysis: Automatically computes Arvind's intrinsic value and Net Present Value.
- Preloaded Information: Historical and projected data provide reliable foundational metrics.
- High-Quality Standards: Perfect for financial analysts, investors, and business consultants alike.
Who Can Benefit from This Product?
- Finance Students: Master valuation methods and apply them to real-world data.
- Academics: Integrate professional valuation models into your teaching or research projects.
- Investors: Challenge your assumptions and evaluate valuation results for Arvind Limited (ARVINDNS).
- Analysts: Enhance your efficiency with a ready-to-use, customizable DCF model.
- Small Business Owners: Understand the valuation processes used for large public companies like Arvind Limited (ARVINDNS).
What This Template Includes
- Pre-Filled DCF Model: Arvind Limited’s financial data preloaded for immediate application.
- WACC Calculator: Comprehensive calculations for Weighted Average Cost of Capital.
- Financial Ratios: Assess Arvind Limited’s profitability, leverage, and operational efficiency.
- Editable Inputs: Modify assumptions such as growth rates, profit margins, and CAPEX to align with your scenarios.
- Financial Statements: Access annual and quarterly reports for in-depth analysis.
- Interactive Dashboard: Effortlessly visualize crucial valuation metrics and outcomes.
Disclaimer
All information, articles, and product details provided on this website are for general informational and educational purposes only. We do not claim any ownership over, nor do we intend to infringe upon, any trademarks, copyrights, logos, brand names, or other intellectual property mentioned or depicted on this site. Such intellectual property remains the property of its respective owners, and any references here are made solely for identification or informational purposes, without implying any affiliation, endorsement, or partnership.
We make no representations or warranties, express or implied, regarding the accuracy, completeness, or suitability of any content or products presented. Nothing on this website should be construed as legal, tax, investment, financial, medical, or other professional advice. In addition, no part of this site—including articles or product references—constitutes a solicitation, recommendation, endorsement, advertisement, or offer to buy or sell any securities, franchises, or other financial instruments, particularly in jurisdictions where such activity would be unlawful.
All content is of a general nature and may not address the specific circumstances of any individual or entity. It is not a substitute for professional advice or services. Any actions you take based on the information provided here are strictly at your own risk. You accept full responsibility for any decisions or outcomes arising from your use of this website and agree to release us from any liability in connection with your use of, or reliance upon, the content or products found herein.