
|
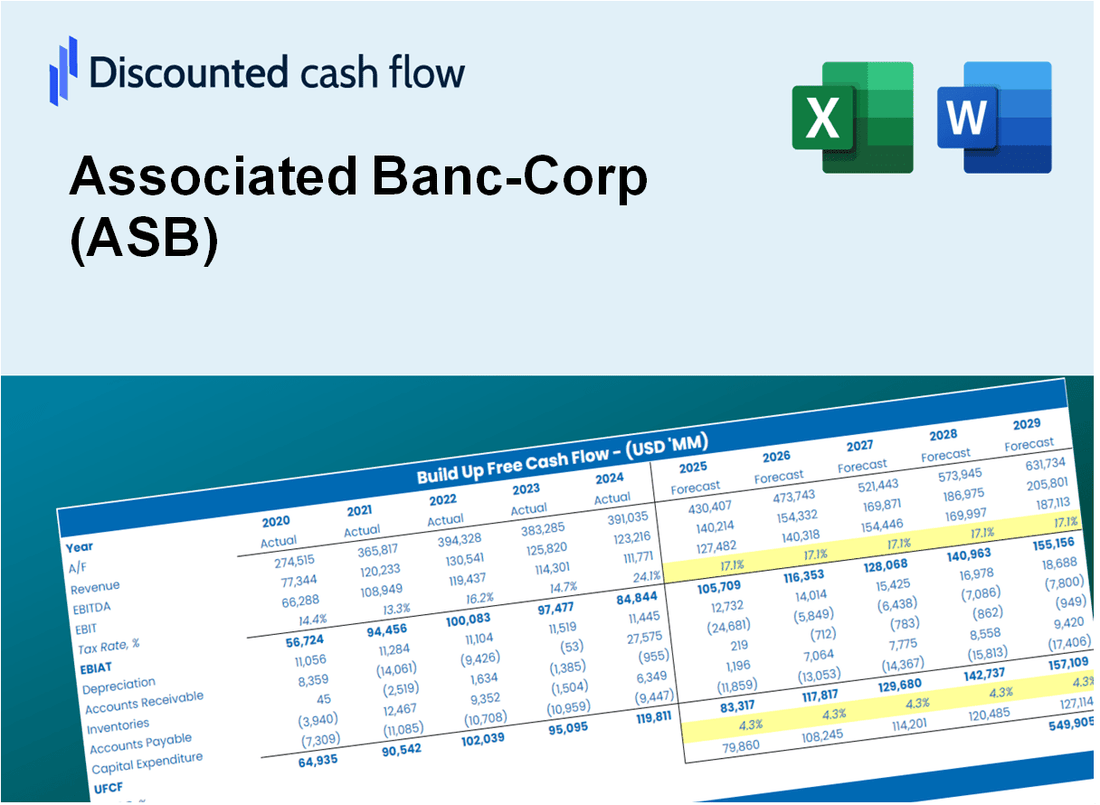
Assoziiertes Banc-Corp (ASB) -DCF-Bewertung |
Fully Editable: Tailor To Your Needs In Excel Or Sheets
Professional Design: Trusted, Industry-Standard Templates
Investor-Approved Valuation Models
MAC/PC Compatible, Fully Unlocked
No Expertise Is Needed; Easy To Follow
Associated Banc-Corp (ASB) Bundle
Stürzen Sie Ihre Analyse und verbessern Sie die Präzision mit unserem (ASB) DCF -Taschenrechner! Dieses Tool ist mit real assoziierten Banc-CORP-Daten und anpassbaren Annahmen geladen und kann Sie wie ein erfahrener Investor prognostizieren, bewerten und Wert (ASB) prognostizieren, bewerten und Wert haben.
Discounted Cash Flow (DCF) - (USD MM)
| Year | AY1 2020 |
AY2 2021 |
AY3 2022 |
AY4 2023 |
AY5 2024 |
FY1 2025 |
FY2 2026 |
FY3 2027 |
FY4 2028 |
FY5 2029 |
|---|---|---|---|---|---|---|---|---|---|---|
| Revenue | 1,406.8 | 1,121.4 | 1,421.7 | 2,015.8 | 2,104.8 | 2,382.1 | 2,695.9 | 3,051.1 | 3,453.0 | 3,907.9 |
| Revenue Growth, % | 0 | -20.29 | 26.78 | 41.79 | 4.42 | 13.17 | 13.17 | 13.17 | 13.17 | 13.17 |
| EBITDA | 435.4 | 506.7 | 528.5 | 300.4 | 237.0 | 664.5 | 752.0 | 851.1 | 963.2 | 1,090.1 |
| EBITDA, % | 30.95 | 45.19 | 37.17 | 14.9 | 11.26 | 27.89 | 27.89 | 27.89 | 27.89 | 27.89 |
| Depreciation | 108.5 | 70.4 | 68.9 | 94.3 | 102.5 | 135.2 | 153.0 | 173.2 | 196.0 | 221.8 |
| Depreciation, % | 7.71 | 6.28 | 4.84 | 4.68 | 4.87 | 5.68 | 5.68 | 5.68 | 5.68 | 5.68 |
| EBIT | 327.0 | 436.3 | 459.6 | 206.1 | 134.5 | 529.3 | 599.0 | 677.9 | 767.2 | 868.3 |
| EBIT, % | 23.24 | 38.91 | 32.33 | 10.22 | 6.39 | 22.22 | 22.22 | 22.22 | 22.22 | 22.22 |
| Total Cash | 3,800.4 | 5,357.5 | 3,335.7 | 4,524.7 | 5,574.1 | 2,382.1 | 2,695.9 | 3,051.1 | 3,453.0 | 3,907.9 |
| Total Cash, percent | .0 | .0 | .0 | .0 | .0 | .0 | .0 | .0 | .0 | .0 |
| Account Receivables | 90.3 | 80.5 | 144.4 | 169.6 | 167.8 | 191.2 | 216.4 | 244.9 | 277.2 | 313.7 |
| Account Receivables, % | 6.42 | 7.18 | 10.16 | 8.41 | 7.97 | 8.03 | 8.03 | 8.03 | 8.03 | 8.03 |
| Inventories | .0 | .0 | .0 | .0 | .0 | .0 | .0 | .0 | .0 | .0 |
| Inventories, % | 0 | 0 | 0 | 0 | 0 | 0 | 0 | 0 | 0 | 0 |
| Accounts Payable | .0 | .0 | .0 | .0 | .0 | .0 | .0 | .0 | .0 | .0 |
| Accounts Payable, % | 0 | 0 | 0 | 0 | 0 | 0 | 0 | 0 | 0 | 0 |
| Capital Expenditure | -54.9 | -52.3 | -62.7 | -61.8 | -45.0 | -86.6 | -98.0 | -110.9 | -125.5 | -142.1 |
| Capital Expenditure, % | -3.9 | -4.66 | -4.41 | -3.07 | -2.14 | -3.64 | -3.64 | -3.64 | -3.64 | -3.64 |
| Tax Rate, % | 8.41 | 8.41 | 8.41 | 8.41 | 8.41 | 8.41 | 8.41 | 8.41 | 8.41 | 8.41 |
| EBITAT | 306.8 | 351.0 | 366.1 | 183.0 | 123.1 | 459.7 | 520.3 | 588.8 | 666.4 | 754.2 |
| Depreciation | ||||||||||
| Changes in Account Receivables | ||||||||||
| Changes in Inventories | ||||||||||
| Changes in Accounts Payable | ||||||||||
| Capital Expenditure | ||||||||||
| UFCF | 270.1 | 378.9 | 308.4 | 190.3 | 182.5 | 484.9 | 550.1 | 622.6 | 704.6 | 797.4 |
| WACC, % | 18.51 | 16.47 | 16.35 | 17.75 | 18.17 | 17.45 | 17.45 | 17.45 | 17.45 | 17.45 |
| PV UFCF | ||||||||||
| SUM PV UFCF | 1,922.9 | |||||||||
| Long Term Growth Rate, % | 2.00 | |||||||||
| Free cash flow (T + 1) | 813 | |||||||||
| Terminal Value | 5,264 | |||||||||
| Present Terminal Value | 2,355 | |||||||||
| Enterprise Value | 4,278 | |||||||||
| Net Debt | 2,164 | |||||||||
| Equity Value | 2,114 | |||||||||
| Diluted Shares Outstanding, MM | 153 | |||||||||
| Equity Value Per Share | 13.78 |
What You Will Get
- Editable Excel Template: A fully customizable Excel-based DCF Calculator featuring pre-filled financial data for Associated Banc-Corp (ASB).
- Real-World Data: Access to historical performance metrics and forward-looking estimates (highlighted in the yellow cells).
- Forecast Flexibility: Modify key assumptions such as revenue growth, EBITDA percentage, and WACC.
- Automatic Calculations: Quickly observe how your inputs affect the valuation of Associated Banc-Corp (ASB).
- Professional Tool: Designed for investors, CFOs, consultants, and financial analysts.
- User-Friendly Design: Organized for clarity and ease of navigation, complete with step-by-step guidance.
Key Features
- Comprehensive DCF Calculator: Features detailed unlevered and levered DCF valuation models tailored for Associated Banc-Corp (ASB).
- WACC Calculator: Includes a pre-built Weighted Average Cost of Capital sheet with customizable parameters for precise analysis.
- Flexible Forecast Assumptions: Easily adjust growth rates, capital expenditures, and discount rates to fit your analysis.
- Integrated Financial Ratios: Evaluate profitability, leverage, and efficiency ratios specific to Associated Banc-Corp (ASB).
- Interactive Dashboard and Charts: Visual representations that summarize essential valuation metrics for straightforward interpretation.
How It Works
- Step 1: Download the Excel file.
- Step 2: Review Associated Banc-Corp’s pre-filled financial data and forecasts.
- Step 3: Modify key inputs such as revenue growth, WACC, and tax rates (highlighted cells).
- Step 4: Observe the DCF model update in real-time as you adjust assumptions.
- Step 5: Analyze the outputs and utilize the results for investment decisions regarding Associated Banc-Corp (ASB).
Why Choose This Calculator for Associated Banc-Corp (ASB)?
- All-in-One Solution: Offers DCF, WACC, and financial ratio analyses seamlessly integrated.
- Flexible Inputs: Modify the yellow-highlighted fields to explore different financial scenarios.
- In-Depth Analysis: Automatically computes Associated Banc-Corp’s intrinsic value and Net Present Value.
- Preloaded Information: Access to historical and projected data for reliable analysis.
- High-Quality Standards: Perfect for financial analysts, investors, and business consultants focused on ASB.
Who Should Use Associated Banc-Corp (ASB)?
- Investors: Make informed investment choices with the insights provided by Associated Banc-Corp (ASB).
- Financial Analysts: Streamline your analysis with comprehensive reports and data from Associated Banc-Corp (ASB).
- Consultants: Easily integrate financial data from Associated Banc-Corp (ASB) into client presentations and strategies.
- Finance Enthusiasts: Enhance your knowledge of banking and finance through the resources offered by Associated Banc-Corp (ASB).
- Educators and Students: Utilize the information from Associated Banc-Corp (ASB) as a valuable educational resource in finance courses.
What the Template Contains
- Historical Data: Includes Associated Banc-Corp’s (ASB) past financials and baseline forecasts.
- DCF and Levered DCF Models: Detailed templates to calculate Associated Banc-Corp’s (ASB) intrinsic value.
- WACC Sheet: Pre-built calculations for Weighted Average Cost of Capital specific to Associated Banc-Corp (ASB).
- Editable Inputs: Modify key drivers like growth rates, EBITDA %, and CAPEX assumptions for Associated Banc-Corp (ASB).
- Quarterly and Annual Statements: A complete breakdown of Associated Banc-Corp’s (ASB) financials.
- Interactive Dashboard: Visualize valuation results and projections for Associated Banc-Corp (ASB) dynamically.
Disclaimer
All information, articles, and product details provided on this website are for general informational and educational purposes only. We do not claim any ownership over, nor do we intend to infringe upon, any trademarks, copyrights, logos, brand names, or other intellectual property mentioned or depicted on this site. Such intellectual property remains the property of its respective owners, and any references here are made solely for identification or informational purposes, without implying any affiliation, endorsement, or partnership.
We make no representations or warranties, express or implied, regarding the accuracy, completeness, or suitability of any content or products presented. Nothing on this website should be construed as legal, tax, investment, financial, medical, or other professional advice. In addition, no part of this site—including articles or product references—constitutes a solicitation, recommendation, endorsement, advertisement, or offer to buy or sell any securities, franchises, or other financial instruments, particularly in jurisdictions where such activity would be unlawful.
All content is of a general nature and may not address the specific circumstances of any individual or entity. It is not a substitute for professional advice or services. Any actions you take based on the information provided here are strictly at your own risk. You accept full responsibility for any decisions or outcomes arising from your use of this website and agree to release us from any liability in connection with your use of, or reliance upon, the content or products found herein.