
|
Algoma Steel Group Inc. (ASTL) DCF -Bewertung |
Fully Editable: Tailor To Your Needs In Excel Or Sheets
Professional Design: Trusted, Industry-Standard Templates
Investor-Approved Valuation Models
MAC/PC Compatible, Fully Unlocked
No Expertise Is Needed; Easy To Follow
Algoma Steel Group Inc. (ASTL) Bundle
Verbessern Sie Ihre Anlagestrategie mit dem DCF -Taschenrechner der Algoma Steel Group Inc. (ASTL)! Überprüfen Sie die Finanzdaten des authentischen Algoms, passen Sie Wachstumsprojektionen und -kosten an und beachten Sie sofort, wie sich diese Veränderungen auf den inneren Wert der Algoma Steel Group Inc. (ASTL) auswirken.
What You Will Get
- Real ASTL Financials: Access to historical and projected data for precise valuation.
- Customizable Inputs: Adjust WACC, tax rates, revenue growth, and capital expenditures as needed.
- Dynamic Calculations: Intrinsic value and NPV are computed automatically.
- Scenario Analysis: Evaluate various scenarios to assess Algoma Steel's future performance.
- User-Friendly Design: Designed for professionals while remaining approachable for newcomers.
Key Features
- Comprehensive DCF Calculator: Offers detailed unlevered and levered DCF valuation models tailored for Algoma Steel Group Inc. (ASTL).
- WACC Calculator: Features a pre-built Weighted Average Cost of Capital sheet with customizable parameters for precise calculations.
- Adjustable Forecast Assumptions: Easily modify growth rates, capital expenditures, and discount rates to fit your analysis.
- Integrated Financial Ratios: Evaluate profitability, leverage, and efficiency ratios specifically for Algoma Steel Group Inc. (ASTL).
- Visual Dashboard and Charts: Generate visual outputs that summarize essential valuation metrics for straightforward analysis.
How It Works
- 1. Access the Model: Download and open the Excel template featuring Algoma Steel Group Inc. (ASTL)'s data.
- 2. Modify Key Variables: Adjust crucial inputs such as growth projections, WACC, and capital investment figures.
- 3. Analyze Results in Real-Time: The DCF model automatically computes intrinsic value and NPV based on your inputs.
- 4. Explore Different Scenarios: Evaluate various forecasts to assess multiple valuation possibilities.
- 5. Make Informed Decisions: Deliver professional valuation analyses to enhance your strategic choices.
Why Choose Algoma Steel Group Inc. (ASTL)?
- Time-Efficient: Quickly access essential metrics without the hassle of complex calculations.
- Enhanced Precision: Utilize verified data and established formulas for accurate financial assessments.
- Completely Adaptable: Modify the model to align with your specific forecasts and expectations.
- User-Friendly: Intuitive visualizations and outputs simplify the analysis process.
- Endorsed by Industry Leaders: Crafted for professionals who prioritize accuracy and functionality.
Who Should Use This Product?
- Investors: Accurately assess Algoma Steel Group Inc.’s (ASTL) fair value prior to making investment choices.
- CFOs: Utilize a professional-grade DCF model for financial reporting and analysis specific to Algoma Steel Group Inc. (ASTL).
- Consultants: Efficiently modify the template for valuation reports tailored for clients interested in Algoma Steel Group Inc. (ASTL).
- Entrepreneurs: Acquire knowledge on financial modeling techniques employed by leading steel companies.
- Educators: Implement it as a teaching resource to illustrate valuation methodologies relevant to the steel industry.
What the Template Contains
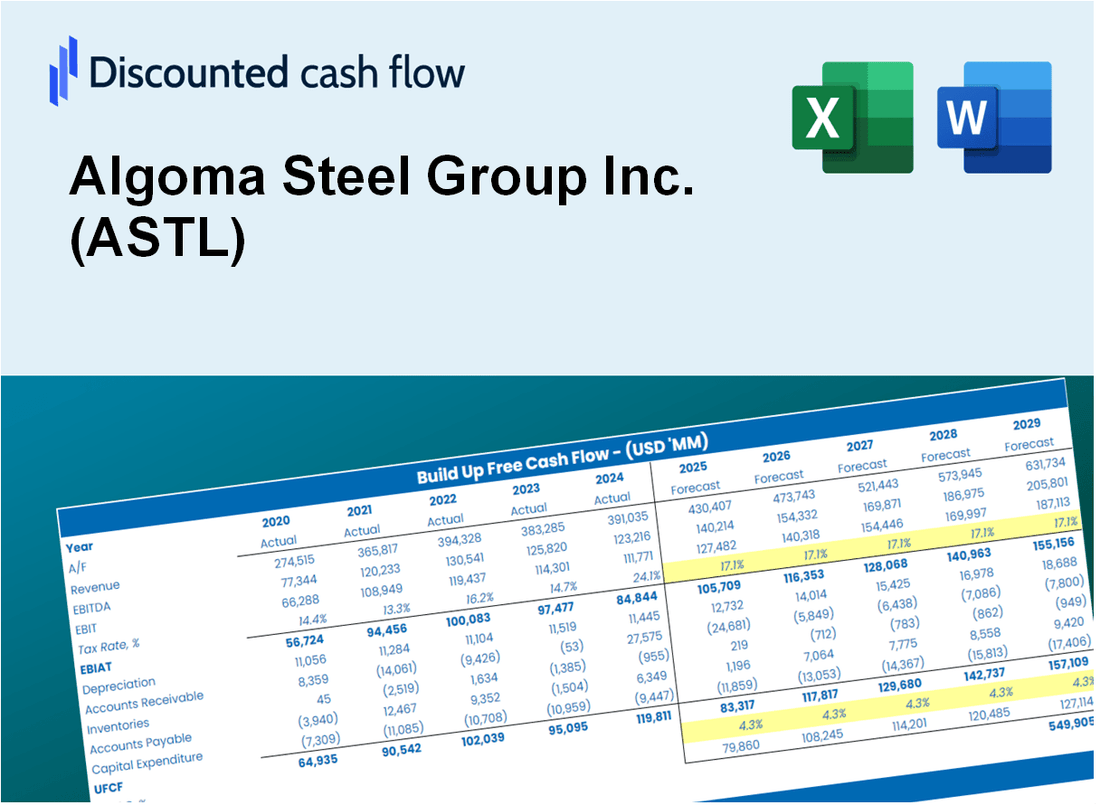
- Operating and Balance Sheet Data: Pre-filled Algoma Steel Group Inc. (ASTL) historical data and forecasts, including revenue, EBITDA, EBIT, and capital expenditures.
- WACC Calculation: A dedicated sheet for Weighted Average Cost of Capital (WACC), including parameters like Beta, risk-free rate, and share price.
- DCF Valuation (Unlevered and Levered): Editable Discounted Cash Flow models showing intrinsic value with detailed calculations.
- Financial Statements: Pre-loaded financial statements (annual and quarterly) to support analysis.
- Key Ratios: Includes profitability, leverage, and efficiency ratios for Algoma Steel Group Inc. (ASTL).
- Dashboard and Charts: Visual summary of valuation outputs and assumptions to analyze results easily.
Disclaimer
All information, articles, and product details provided on this website are for general informational and educational purposes only. We do not claim any ownership over, nor do we intend to infringe upon, any trademarks, copyrights, logos, brand names, or other intellectual property mentioned or depicted on this site. Such intellectual property remains the property of its respective owners, and any references here are made solely for identification or informational purposes, without implying any affiliation, endorsement, or partnership.
We make no representations or warranties, express or implied, regarding the accuracy, completeness, or suitability of any content or products presented. Nothing on this website should be construed as legal, tax, investment, financial, medical, or other professional advice. In addition, no part of this site—including articles or product references—constitutes a solicitation, recommendation, endorsement, advertisement, or offer to buy or sell any securities, franchises, or other financial instruments, particularly in jurisdictions where such activity would be unlawful.
All content is of a general nature and may not address the specific circumstances of any individual or entity. It is not a substitute for professional advice or services. Any actions you take based on the information provided here are strictly at your own risk. You accept full responsibility for any decisions or outcomes arising from your use of this website and agree to release us from any liability in connection with your use of, or reliance upon, the content or products found herein.