
|
ASE Technology Holding Co., Ltd. (ASX) DCF -Bewertung |
Fully Editable: Tailor To Your Needs In Excel Or Sheets
Professional Design: Trusted, Industry-Standard Templates
Investor-Approved Valuation Models
MAC/PC Compatible, Fully Unlocked
No Expertise Is Needed; Easy To Follow
ASE Technology Holding Co., Ltd. (ASX) Bundle
Verbessern Sie Ihre Anlagestrategie mit dem [Symbol] DCF -Taschenrechner! Tauchen Sie in die Real ASE Technology Holding Co., Ltd. Financials, stellen Sie Wachstumsprojektionen und -kosten an und visualisieren Sie sofort, wie sich diese Modifikationen auf den intrinsischen Wert [Symbol] auswirken.
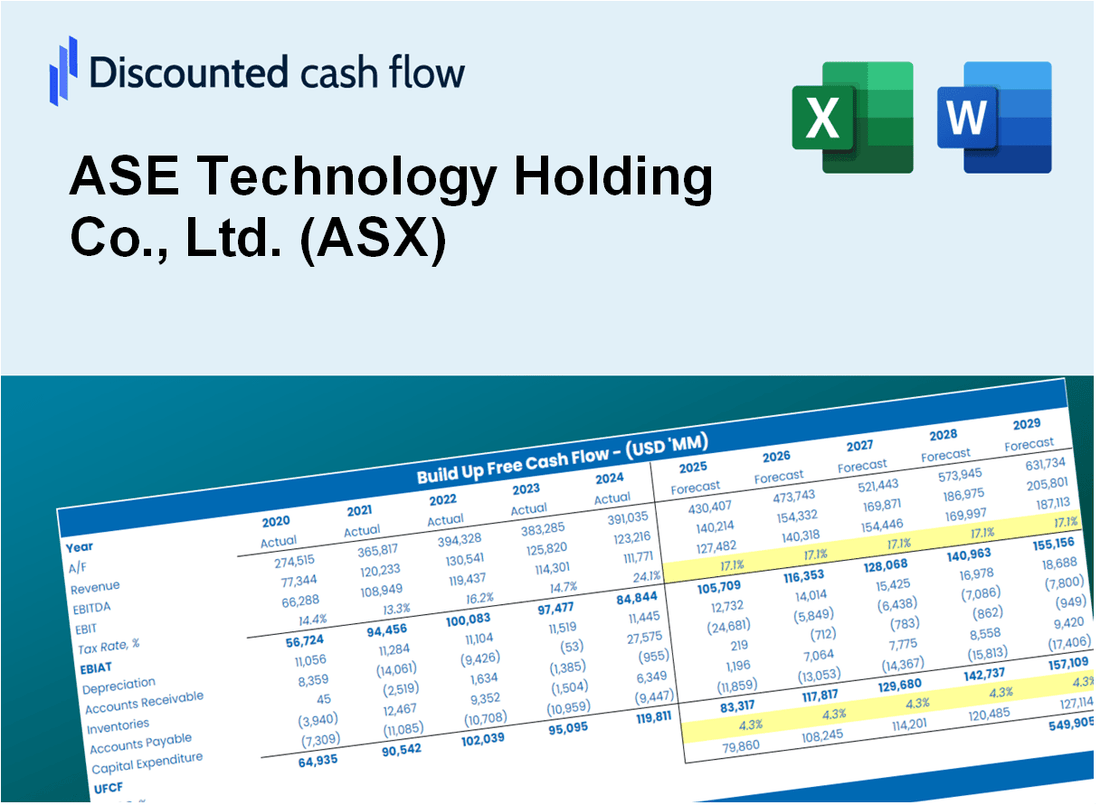
Discounted Cash Flow (DCF) - (USD MM)
| Year | AY1 2020 |
AY2 2021 |
AY3 2022 |
AY4 2023 |
AY5 2024 |
FY1 2025 |
FY2 2026 |
FY3 2027 |
FY4 2028 |
FY5 2029 |
|---|---|---|---|---|---|---|---|---|---|---|
| Revenue | 15,336.4 | 18,327.3 | 21,570.8 | 18,710.5 | 19,144.4 | 20,401.1 | 21,740.4 | 23,167.6 | 24,688.4 | 26,309.1 |
| Revenue Growth, % | 0 | 19.5 | 17.7 | -13.26 | 2.32 | 6.56 | 6.56 | 6.56 | 6.56 | 6.56 |
| EBITDA | 2,873.8 | 4,371.8 | 4,464.6 | 3,319.8 | 3,482.1 | 4,048.4 | 4,314.2 | 4,597.4 | 4,899.2 | 5,220.8 |
| EBITDA, % | 18.74 | 23.85 | 20.7 | 17.74 | 18.19 | 19.84 | 19.84 | 19.84 | 19.84 | 19.84 |
| Depreciation | 1,630.1 | 1,729.0 | 1,747.4 | 1,784.6 | 1,923.3 | 1,948.2 | 2,076.1 | 2,212.4 | 2,357.6 | 2,512.4 |
| Depreciation, % | 10.63 | 9.43 | 8.1 | 9.54 | 10.05 | 9.55 | 9.55 | 9.55 | 9.55 | 9.55 |
| EBIT | 1,243.7 | 2,642.8 | 2,717.2 | 1,535.2 | 1,558.8 | 2,100.3 | 2,238.1 | 2,385.0 | 2,541.6 | 2,708.5 |
| EBIT, % | 8.11 | 14.42 | 12.6 | 8.21 | 8.14 | 10.29 | 10.29 | 10.29 | 10.29 | 10.29 |
| Total Cash | 1,814.5 | 2,544.9 | 2,109.3 | 2,294.8 | 2,761.0 | 2,537.2 | 2,703.7 | 2,881.2 | 3,070.3 | 3,271.9 |
| Total Cash, percent | .0 | .0 | .0 | .0 | .0 | .0 | .0 | .0 | .0 | .0 |
| Account Receivables | 3,247.9 | 4,351.8 | 4,417.8 | 3,895.3 | 3,944.8 | 4,358.8 | 4,644.9 | 4,949.8 | 5,274.8 | 5,621.0 |
| Account Receivables, % | 21.18 | 23.74 | 20.48 | 20.82 | 20.61 | 21.37 | 21.37 | 21.37 | 21.37 | 21.37 |
| Inventories | 1,993.1 | 2,355.1 | 2,984.7 | 2,034.5 | 1,967.2 | 2,482.1 | 2,645.0 | 2,818.6 | 3,003.7 | 3,200.9 |
| Inventories, % | 13 | 12.85 | 13.84 | 10.87 | 10.28 | 12.17 | 12.17 | 12.17 | 12.17 | 12.17 |
| Accounts Payable | 2,355.8 | 2,716.0 | 2,540.0 | 2,261.3 | 2,515.1 | 2,741.0 | 2,921.0 | 3,112.7 | 3,317.1 | 3,534.8 |
| Accounts Payable, % | 15.36 | 14.82 | 11.78 | 12.09 | 13.14 | 13.44 | 13.44 | 13.44 | 13.44 | 13.44 |
| Capital Expenditure | -1,852.9 | -2,228.3 | -2,311.5 | -1,741.4 | -2,626.4 | -2,365.8 | -2,521.1 | -2,686.6 | -2,862.9 | -3,050.9 |
| Capital Expenditure, % | -12.08 | -12.16 | -10.72 | -9.31 | -13.72 | -11.6 | -11.6 | -11.6 | -11.6 | -11.6 |
| Tax Rate, % | 22.41 | 22.41 | 22.41 | 22.41 | 22.41 | 22.41 | 22.41 | 22.41 | 22.41 | 22.41 |
| EBITAT | 938.7 | 1,978.7 | 2,047.3 | 1,174.3 | 1,209.4 | 1,595.2 | 1,700.0 | 1,811.5 | 1,930.5 | 2,057.2 |
| Depreciation | ||||||||||
| Changes in Account Receivables | ||||||||||
| Changes in Inventories | ||||||||||
| Changes in Accounts Payable | ||||||||||
| Capital Expenditure | ||||||||||
| UFCF | -2,169.4 | 373.9 | 611.6 | 2,411.5 | 777.8 | 474.8 | 985.8 | 1,050.5 | 1,119.5 | 1,193.0 |
| WACC, % | 6.82 | 6.81 | 6.82 | 6.83 | 6.84 | 6.82 | 6.82 | 6.82 | 6.82 | 6.82 |
| PV UFCF | ||||||||||
| SUM PV UFCF | 3,887.6 | |||||||||
| Long Term Growth Rate, % | 2.00 | |||||||||
| Free cash flow (T + 1) | 1,217 | |||||||||
| Terminal Value | 25,234 | |||||||||
| Present Terminal Value | 18,141 | |||||||||
| Enterprise Value | 22,029 | |||||||||
| Net Debt | 4,017 | |||||||||
| Equity Value | 18,013 | |||||||||
| Diluted Shares Outstanding, MM | 1,100 | |||||||||
| Equity Value Per Share | 16.38 |
What You Will Get
- Real ASE Technology Financial Data: Pre-filled with ASE Technology’s historical and projected data for precise analysis.
- Fully Editable Template: Modify key inputs like revenue growth, WACC, and EBITDA % with ease.
- Automatic Calculations: See ASE Technology’s intrinsic value update instantly based on your changes.
- Professional Valuation Tool: Designed for investors, analysts, and consultants seeking accurate DCF results.
- User-Friendly Design: Simple structure and clear instructions for all experience levels.
Key Features
- 🔍 Real-Life ASE Financials: Pre-filled historical and projected data for ASE Technology Holding Co., Ltd. (ASX).
- ✏️ Fully Customizable Inputs: Adjust all critical parameters (yellow cells) like WACC, growth %, and tax rates.
- 📊 Professional DCF Valuation: Built-in formulas calculate ASE’s intrinsic value using the Discounted Cash Flow method.
- ⚡ Instant Results: Visualize ASE’s valuation instantly after making changes.
- Scenario Analysis: Test and compare outcomes for various financial assumptions side-by-side.
How It Works
- Download the Template: Gain immediate access to the Excel-based ASE Technology DCF Calculator.
- Input Your Assumptions: Modify the yellow-highlighted cells for growth rates, WACC, margins, and other key metrics.
- Instant Calculations: The model will automatically refresh ASE Technology's intrinsic value.
- Test Scenarios: Experiment with various assumptions to assess potential changes in valuation.
- Analyze and Decide: Utilize the findings to inform your investment or financial strategies.
Why Choose This Calculator for ASE Technology Holding Co., Ltd. (ASX)?
- Accuracy: Utilizes real ASE financials to ensure precise data.
- Flexibility: Built to allow users to freely test and adjust inputs.
- Time-Saving: Avoid the complexities of creating a DCF model from the ground up.
- Professional-Grade: Crafted with the precision and usability expected by CFOs.
- User-Friendly: Intuitive design, suitable for users without extensive financial modeling skills.
Who Should Use ASE Technology Holding Co., Ltd. (ASX)?
- Investors: Make informed investment choices with a reliable and comprehensive analysis of ASE Technology's performance.
- Financial Analysts: Utilize advanced financial models tailored for ASE Technology to streamline your analysis process.
- Consultants: Easily customize reports and presentations featuring ASE Technology for your clients.
- Tech Enthusiasts: Enhance your knowledge of the semiconductor industry through in-depth insights into ASE Technology's operations.
- Educators and Students: Leverage ASE Technology's case studies as a practical resource for finance and technology courses.
What the Template Contains
- Preloaded ASX Data: Historical and projected financial data, including revenue, EBIT, and capital expenditures.
- DCF and WACC Models: Professional-grade sheets for calculating intrinsic value and Weighted Average Cost of Capital.
- Editable Inputs: Yellow-highlighted cells for adjusting revenue growth, tax rates, and discount rates.
- Financial Statements: Comprehensive annual and quarterly financials for deeper analysis.
- Key Ratios: Profitability, leverage, and efficiency ratios to evaluate performance.
- Dashboard and Charts: Visual summaries of valuation outcomes and assumptions.
Disclaimer
All information, articles, and product details provided on this website are for general informational and educational purposes only. We do not claim any ownership over, nor do we intend to infringe upon, any trademarks, copyrights, logos, brand names, or other intellectual property mentioned or depicted on this site. Such intellectual property remains the property of its respective owners, and any references here are made solely for identification or informational purposes, without implying any affiliation, endorsement, or partnership.
We make no representations or warranties, express or implied, regarding the accuracy, completeness, or suitability of any content or products presented. Nothing on this website should be construed as legal, tax, investment, financial, medical, or other professional advice. In addition, no part of this site—including articles or product references—constitutes a solicitation, recommendation, endorsement, advertisement, or offer to buy or sell any securities, franchises, or other financial instruments, particularly in jurisdictions where such activity would be unlawful.
All content is of a general nature and may not address the specific circumstances of any individual or entity. It is not a substitute for professional advice or services. Any actions you take based on the information provided here are strictly at your own risk. You accept full responsibility for any decisions or outcomes arising from your use of this website and agree to release us from any liability in connection with your use of, or reliance upon, the content or products found herein.