
|
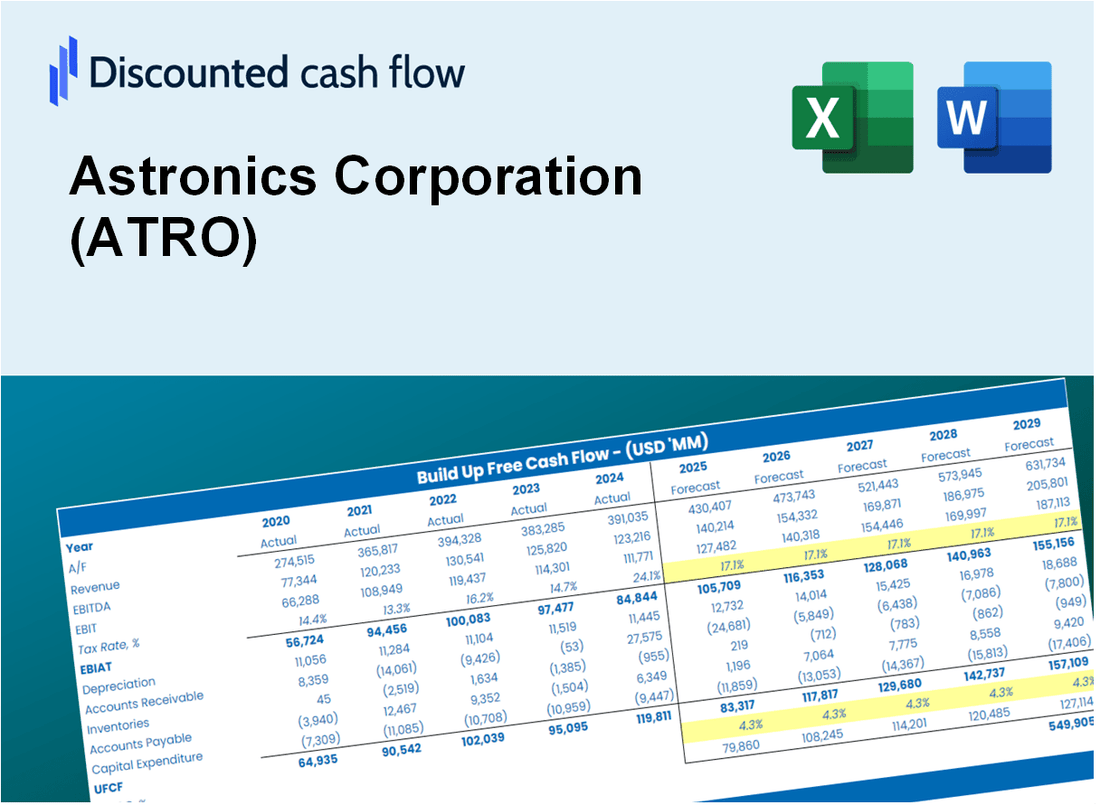
DCF -Bewertung der Astronics Corporation (ATRO) |
Fully Editable: Tailor To Your Needs In Excel Or Sheets
Professional Design: Trusted, Industry-Standard Templates
Investor-Approved Valuation Models
MAC/PC Compatible, Fully Unlocked
No Expertise Is Needed; Easy To Follow
Astronics Corporation (ATRO) Bundle
Erforschen Sie das finanzielle Potenzial der Astronics Corporation (ATRO) mit unserem benutzerfreundlichen DCF-Taschenrechner! Geben Sie Ihre Wachstumsprojektionen, Margenerwartungen und Kostenschätzungen ein, um den intrinsischen Wert der Astronics Corporation (ATRO) zu berechnen und Ihre Anlagestrategie zu verfeinern.
What You Will Get
- Real ATRO Financial Data: Pre-filled with Astronics Corporation’s historical and projected data for precise analysis.
- Fully Editable Template: Modify key inputs like revenue growth, WACC, and EBITDA % with ease.
- Automatic Calculations: See Astronics Corporation’s intrinsic value update instantly based on your changes.
- Professional Valuation Tool: Designed for investors, analysts, and consultants seeking accurate DCF results.
- User-Friendly Design: Simple structure and clear instructions for all experience levels.
Key Features
- Comprehensive Financial Data: Access reliable pre-loaded historical figures and future forecasts for Astronics Corporation (ATRO).
- Adjustable Forecast Parameters: Modify highlighted fields such as WACC, growth rates, and profit margins.
- Real-Time Calculations: Automatic updates for DCF, Net Present Value (NPV), and cash flow assessments.
- User-Friendly Dashboard: Clear charts and summaries to help visualize your valuation outcomes.
- Designed for All Experience Levels: An intuitive layout suitable for investors, CFOs, and consultants alike.
How It Works
- Step 1: Download the Excel file for Astronics Corporation (ATRO).
- Step 2: Review Astronics’ pre-filled financial data and forecasts.
- Step 3: Modify key inputs such as revenue growth, WACC, and tax rates (highlighted cells).
- Step 4: Observe the DCF model update in real-time as you adjust your assumptions.
- Step 5: Analyze the outputs and leverage the results for informed investment decisions.
Why Choose This Calculator for Astronics Corporation (ATRO)?
- Accuracy: Utilizes precise Astronics financial data for reliable results.
- Flexibility: Allows users to easily modify and experiment with inputs.
- Time-Saving: Eliminate the need to create a DCF model from the ground up.
- Professional-Grade: Crafted with the expertise and precision expected at the CFO level.
- User-Friendly: Intuitive design makes it accessible for users without advanced financial skills.
Who Should Use This Product?
- Finance Students: Explore advanced valuation methodologies and apply them using real-world data.
- Academics: Integrate industry-standard models into your teaching or research projects.
- Investors: Validate your investment hypotheses and assess valuation scenarios for Astronics Corporation (ATRO).
- Analysts: Enhance your efficiency with a pre-constructed, customizable DCF model tailored for Astronics Corporation (ATRO).
- Small Business Owners: Understand the analytical approaches used for evaluating large public companies like Astronics Corporation (ATRO).
What the Template Contains
- Pre-Filled Data: Includes Astronics Corporation's historical financials and forecasts.
- Discounted Cash Flow Model: Editable DCF valuation model with automatic calculations.
- Weighted Average Cost of Capital (WACC): A dedicated sheet for calculating WACC based on custom inputs.
- Key Financial Ratios: Analyze Astronics Corporation's profitability, efficiency, and leverage.
- Customizable Inputs: Edit revenue growth, margins, and tax rates with ease.
- Clear Dashboard: Charts and tables summarizing key valuation results.
Disclaimer
All information, articles, and product details provided on this website are for general informational and educational purposes only. We do not claim any ownership over, nor do we intend to infringe upon, any trademarks, copyrights, logos, brand names, or other intellectual property mentioned or depicted on this site. Such intellectual property remains the property of its respective owners, and any references here are made solely for identification or informational purposes, without implying any affiliation, endorsement, or partnership.
We make no representations or warranties, express or implied, regarding the accuracy, completeness, or suitability of any content or products presented. Nothing on this website should be construed as legal, tax, investment, financial, medical, or other professional advice. In addition, no part of this site—including articles or product references—constitutes a solicitation, recommendation, endorsement, advertisement, or offer to buy or sell any securities, franchises, or other financial instruments, particularly in jurisdictions where such activity would be unlawful.
All content is of a general nature and may not address the specific circumstances of any individual or entity. It is not a substitute for professional advice or services. Any actions you take based on the information provided here are strictly at your own risk. You accept full responsibility for any decisions or outcomes arising from your use of this website and agree to release us from any liability in connection with your use of, or reliance upon, the content or products found herein.