
|
Big 5 Sporting Goods Corporation (BGFV) DCF -Bewertung |
Fully Editable: Tailor To Your Needs In Excel Or Sheets
Professional Design: Trusted, Industry-Standard Templates
Investor-Approved Valuation Models
MAC/PC Compatible, Fully Unlocked
No Expertise Is Needed; Easy To Follow
Big 5 Sporting Goods Corporation (BGFV) Bundle
Vereinfachen Sie die Bewertung der Big 5 Sporting Goods Corporation (BGFV) mit diesem anpassbaren DCF -Taschenrechner! Mit Real Big 5 Sporting Goods Corporation (BGFV) -Fonds und einstellbaren Prognoseeingaben können Sie Szenarien testen und Big 5 Sporting Goods Corporation (BGFV) in Minuten aufdecken.
What You Will Get
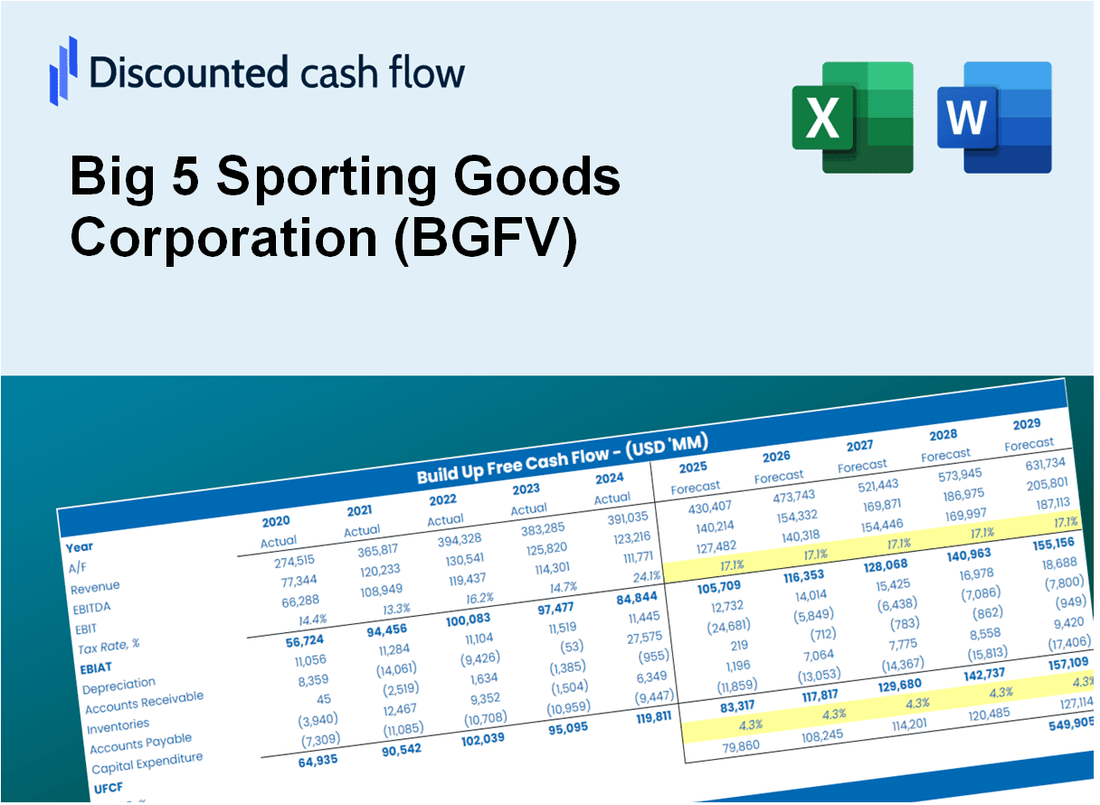
- Real Big 5 Data: Preloaded financials – from revenue to EBIT – based on actual and projected figures for Big 5 Sporting Goods Corporation (BGFV).
- Full Customization: Adjust all critical parameters (yellow cells) like WACC, growth %, and tax rates tailored specifically for (BGFV).
- Instant Valuation Updates: Automatic recalculations to analyze the impact of changes on Big 5's fair value.
- Versatile Excel Template: Designed for quick edits, scenario testing, and detailed projections for (BGFV).
- Time-Saving and Accurate: Avoid building models from scratch while ensuring precision and flexibility for (BGFV).
Key Features
- Comprehensive BGFV Data: Pre-loaded with Big 5 Sporting Goods Corporation’s historical performance metrics and future projections.
- Customizable Variables: Modify growth rates, profit margins, discount rates, tax assumptions, and capital investments.
- Interactive Valuation Tool: Automatically recalculates Net Present Value (NPV) and intrinsic value based on user-defined inputs.
- Multiple Scenario Analysis: Generate various forecasting scenarios to evaluate different valuation results.
- Intuitive User Interface: Designed for ease of use, catering to both industry experts and newcomers.
How It Works
- Download: Obtain the pre-built Excel file containing Big 5 Sporting Goods Corporation’s (BGFV) financial data.
- Customize: Modify projections, such as sales growth, EBITDA margin, and discount rate.
- Update Automatically: The intrinsic value and NPV calculations refresh in real-time.
- Test Scenarios: Develop various forecasts and analyze results instantly.
- Make Decisions: Leverage the valuation outcomes to inform your investment choices.
Why Choose This Calculator for Big 5 Sporting Goods Corporation (BGFV)?
- All-in-One Tool: Features DCF, WACC, and financial ratio analyses tailored for BGFV.
- Adjustable Parameters: Modify the yellow-highlighted cells to explore different financial scenarios.
- In-Depth Analysis: Automatically computes Big 5's intrinsic value and Net Present Value.
- Preloaded Information: Contains historical and projected data for precise calculations.
- High-Quality Standards: Perfect for financial analysts, investors, and business advisors focusing on BGFV.
Who Should Use This Product?
- Professional Investors: Create comprehensive and accurate valuation models for analyzing portfolios related to Big 5 Sporting Goods Corporation (BGFV).
- Corporate Finance Teams: Evaluate valuation scenarios to inform strategic decisions within the organization.
- Consultants and Advisors: Offer clients precise valuation insights for Big 5 Sporting Goods Corporation (BGFV) stock.
- Students and Educators: Utilize real-world data to enhance learning and practice in financial modeling.
- Sports Retail Enthusiasts: Gain insights into how sporting goods companies like Big 5 Sporting Goods Corporation (BGFV) are valued in the market.
What the Template Contains
- Preloaded BGFV Data: Historical and projected financial data, including revenue, EBIT, and capital expenditures.
- DCF and WACC Models: Professional-grade sheets for calculating intrinsic value and Weighted Average Cost of Capital.
- Editable Inputs: Yellow-highlighted cells for adjusting revenue growth, tax rates, and discount rates.
- Financial Statements: Comprehensive annual and quarterly financials for deeper analysis.
- Key Ratios: Profitability, leverage, and efficiency ratios to evaluate performance.
- Dashboard and Charts: Visual summaries of valuation outcomes and assumptions.
Disclaimer
All information, articles, and product details provided on this website are for general informational and educational purposes only. We do not claim any ownership over, nor do we intend to infringe upon, any trademarks, copyrights, logos, brand names, or other intellectual property mentioned or depicted on this site. Such intellectual property remains the property of its respective owners, and any references here are made solely for identification or informational purposes, without implying any affiliation, endorsement, or partnership.
We make no representations or warranties, express or implied, regarding the accuracy, completeness, or suitability of any content or products presented. Nothing on this website should be construed as legal, tax, investment, financial, medical, or other professional advice. In addition, no part of this site—including articles or product references—constitutes a solicitation, recommendation, endorsement, advertisement, or offer to buy or sell any securities, franchises, or other financial instruments, particularly in jurisdictions where such activity would be unlawful.
All content is of a general nature and may not address the specific circumstances of any individual or entity. It is not a substitute for professional advice or services. Any actions you take based on the information provided here are strictly at your own risk. You accept full responsibility for any decisions or outcomes arising from your use of this website and agree to release us from any liability in connection with your use of, or reliance upon, the content or products found herein.