
|
Brighthouse Financial, Inc. (BHF) DCF -Bewertung |
Fully Editable: Tailor To Your Needs In Excel Or Sheets
Professional Design: Trusted, Industry-Standard Templates
Investor-Approved Valuation Models
MAC/PC Compatible, Fully Unlocked
No Expertise Is Needed; Easy To Follow
Brighthouse Financial, Inc. (BHF) Bundle
Entdecken Sie Brighthouse Financial, Inc. (BHF) Financial Outlook mit unserem benutzerfreundlichen DCF-Taschenrechner! Geben Sie Ihre Prognosen für Wachstum, Margen und Ausgaben ein, um Brighthouse Financial, Inc. (BHF) Intrinsic -Wert zu berechnen und Ihren Investitionsansatz zu verfeinern.
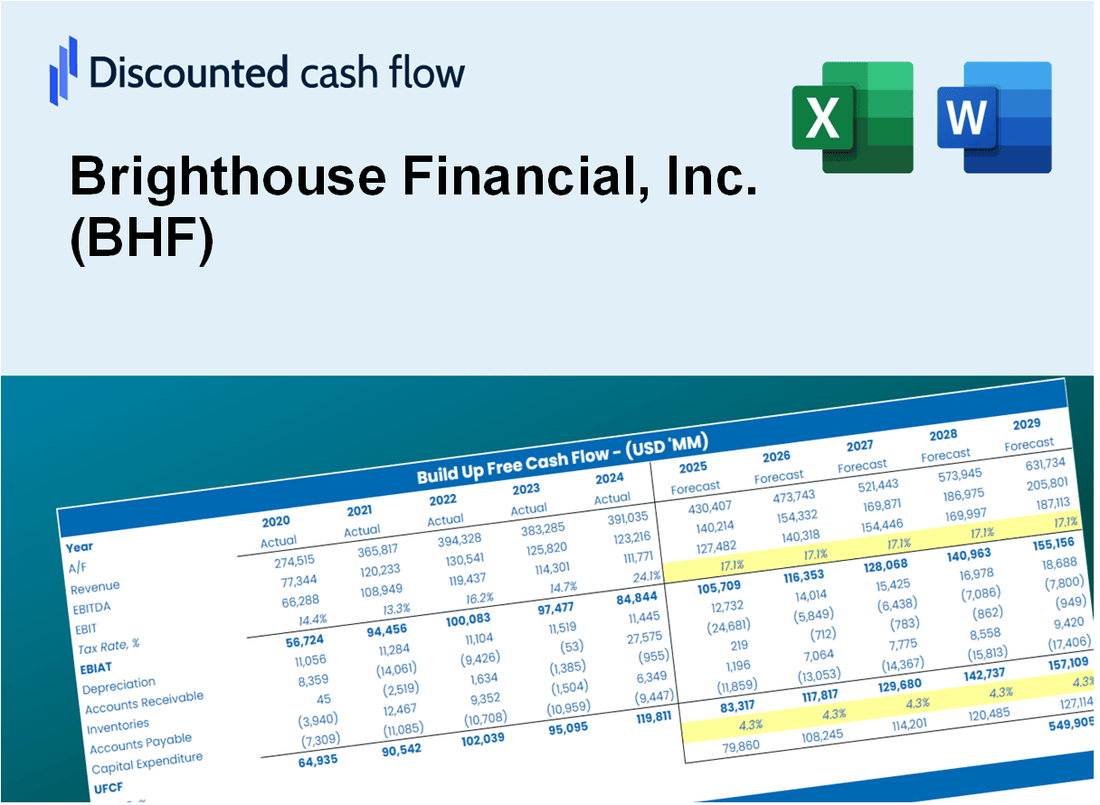
Discounted Cash Flow (DCF) - (USD MM)
| Year | AY1 2020 |
AY2 2021 |
AY3 2022 |
AY4 2023 |
AY5 2024 |
FY1 2025 |
FY2 2026 |
FY3 2027 |
FY4 2028 |
FY5 2029 |
|---|---|---|---|---|---|---|---|---|---|---|
| Revenue | 8,266.0 | 3,585.0 | 6,630.0 | 3,950.0 | 4,369.0 | 4,352.5 | 4,336.1 | 4,319.8 | 4,303.5 | 4,287.3 |
| Revenue Growth, % | 0 | -56.63 | 84.94 | -40.42 | 10.61 | -0.37676 | -0.37676 | -0.37676 | -0.37676 | -0.37676 |
| EBITDA | -1,235.0 | 2,172.0 | 4,885.0 | -1,321.0 | 574.0 | 862.0 | 858.7 | 855.5 | 852.3 | 849.1 |
| EBITDA, % | -14.94 | 60.59 | 73.68 | -33.44 | 13.14 | 19.8 | 19.8 | 19.8 | 19.8 | 19.8 |
| Depreciation | .0 | .0 | .0 | .0 | .0 | .0 | .0 | .0 | .0 | .0 |
| Depreciation, % | 0 | 0 | 0 | 0 | 0 | 0 | 0 | 0 | 0 | 0 |
| EBIT | -1,235.0 | 2,172.0 | 4,885.0 | -1,321.0 | 574.0 | 862.0 | 858.7 | 855.5 | 852.3 | 849.1 |
| EBIT, % | -14.94 | 60.59 | 73.68 | -33.44 | 13.14 | 19.8 | 19.8 | 19.8 | 19.8 | 19.8 |
| Total Cash | 89,845.0 | 93,998.0 | 80,773.0 | 3,851.0 | 86,968.0 | 4,330.7 | 4,314.4 | 4,298.1 | 4,282.0 | 4,265.8 |
| Total Cash, percent | .0 | .0 | .0 | .0 | .0 | .0 | .0 | .0 | .0 | .0 |
| Account Receivables | 16,158.0 | 16,094.0 | 18,586.0 | 19,788.0 | 21,145.0 | 4,352.5 | 4,336.1 | 4,319.8 | 4,303.5 | 4,287.3 |
| Account Receivables, % | 195.48 | 448.93 | 280.33 | 500.96 | 483.98 | 100 | 100 | 100 | 100 | 100 |
| Inventories | .0 | -24,093.0 | .0 | .0 | .0 | -870.5 | -867.2 | -864.0 | -860.7 | -857.5 |
| Inventories, % | 0 | -672.05 | 0 | 0 | 0 | -20 | -20 | -20 | -20 | -20 |
| Accounts Payable | .0 | .0 | .0 | 10,323.0 | .0 | 870.5 | 867.2 | 864.0 | 860.7 | 857.5 |
| Accounts Payable, % | 0 | 0 | 0 | 261.34 | 0 | 20 | 20 | 20 | 20 | 20 |
| Capital Expenditure | .0 | .0 | .0 | .0 | .0 | .0 | .0 | .0 | .0 | .0 |
| Capital Expenditure, % | 0 | 0 | 0 | 0 | 0 | 0 | 0 | 0 | 0 | 0 |
| Tax Rate, % | 8.06 | 8.06 | 8.06 | 8.06 | 8.06 | 8.06 | 8.06 | 8.06 | 8.06 | 8.06 |
| EBITAT | -923.4 | 1,776.3 | 4,004.4 | -996.6 | 527.8 | 699.8 | 697.1 | 694.5 | 691.9 | 689.3 |
| Depreciation | ||||||||||
| Changes in Account Receivables | ||||||||||
| Changes in Inventories | ||||||||||
| Changes in Accounts Payable | ||||||||||
| Capital Expenditure | ||||||||||
| UFCF | -17,081.4 | 25,933.3 | -22,580.6 | 8,124.4 | -11,152.2 | 19,233.2 | 707.0 | 704.3 | 701.7 | 699.0 |
| WACC, % | 6.3 | 6.44 | 6.45 | 6.31 | 6.66 | 6.43 | 6.43 | 6.43 | 6.43 | 6.43 |
| PV UFCF | ||||||||||
| SUM PV UFCF | 20,338.0 | |||||||||
| Long Term Growth Rate, % | 2.00 | |||||||||
| Free cash flow (T + 1) | 713 | |||||||||
| Terminal Value | 16,089 | |||||||||
| Present Terminal Value | 11,781 | |||||||||
| Enterprise Value | 32,119 | |||||||||
| Net Debt | -1,890 | |||||||||
| Equity Value | 34,009 | |||||||||
| Diluted Shares Outstanding, MM | 62 | |||||||||
| Equity Value Per Share | 552.09 |
What You Will Get
- Editable Forecast Inputs: Easily modify assumptions (growth %, margins, WACC) to explore various scenarios.
- Real-World Data: Brighthouse Financial's (BHF) financial information pre-filled to facilitate your analysis.
- Automatic DCF Outputs: The template computes Net Present Value (NPV) and intrinsic value automatically.
- Customizable and Professional: A refined Excel model that adjusts to your valuation requirements.
- Built for Analysts and Investors: Perfect for assessing projections, validating strategies, and optimizing your time.
Key Features
- Customizable Financial Inputs: Adjust essential metrics such as premium growth, claims ratios, and operating expenses.
- Instant DCF Valuation: Provides immediate calculations of intrinsic value, NPV, and additional financial metrics.
- High Precision Accuracy: Leverages Brighthouse Financial's actual financial data for credible valuation results.
- Effortless Scenario Testing: Easily evaluate various assumptions and analyze different outcomes.
- Efficiency Booster: Remove the hassle of constructing intricate valuation models from the ground up.
How It Works
- Step 1: Download the prebuilt Excel template with Brighthouse Financial's data included.
- Step 2: Explore the pre-filled sheets and understand the key metrics for Brighthouse Financial (BHF).
- Step 3: Update forecasts and assumptions in the editable yellow cells (WACC, growth, margins).
- Step 4: Instantly view recalculated results, including Brighthouse Financial's intrinsic value.
- Step 5: Make informed investment decisions or generate reports using the outputs.
Why Choose This Calculator?
- Designed for Financial Experts: A sophisticated tool tailored for analysts, CFOs, and financial consultants.
- Comprehensive Data: Brighthouse Financial’s historical and projected financials preloaded for enhanced accuracy.
- Flexible Scenario Analysis: Effortlessly simulate various forecasts and assumptions.
- Insightful Outputs: Automatically computes intrinsic value, NPV, and essential financial metrics.
- User-Friendly Interface: Step-by-step guidance to help you navigate the calculations.
Who Should Use Brighthouse Financial, Inc. (BHF)?
- Investors: Gain insights to make informed decisions with our comprehensive financial products.
- Financial Advisors: Enhance client portfolios using our tailored insurance solutions.
- Consultants: Seamlessly integrate our offerings into client strategies and presentations.
- Insurance Enthusiasts: Explore innovative insurance concepts and strategies with practical examples.
- Educators and Students: Utilize our resources as a valuable tool for learning about financial security and insurance.
What the Template Contains
- Operating and Balance Sheet Data: Pre-filled Brighthouse Financial, Inc. (BHF) historical data and forecasts, including revenue, EBITDA, EBIT, and capital expenditures.
- WACC Calculation: A dedicated sheet for Weighted Average Cost of Capital (WACC), including parameters like Beta, risk-free rate, and share price.
- DCF Valuation (Unlevered and Levered): Editable Discounted Cash Flow models showing intrinsic value with detailed calculations.
- Financial Statements: Pre-loaded financial statements (annual and quarterly) to support analysis.
- Key Ratios: Includes profitability, leverage, and efficiency ratios for Brighthouse Financial, Inc. (BHF).
- Dashboard and Charts: Visual summary of valuation outputs and assumptions to analyze results easily.
Disclaimer
All information, articles, and product details provided on this website are for general informational and educational purposes only. We do not claim any ownership over, nor do we intend to infringe upon, any trademarks, copyrights, logos, brand names, or other intellectual property mentioned or depicted on this site. Such intellectual property remains the property of its respective owners, and any references here are made solely for identification or informational purposes, without implying any affiliation, endorsement, or partnership.
We make no representations or warranties, express or implied, regarding the accuracy, completeness, or suitability of any content or products presented. Nothing on this website should be construed as legal, tax, investment, financial, medical, or other professional advice. In addition, no part of this site—including articles or product references—constitutes a solicitation, recommendation, endorsement, advertisement, or offer to buy or sell any securities, franchises, or other financial instruments, particularly in jurisdictions where such activity would be unlawful.
All content is of a general nature and may not address the specific circumstances of any individual or entity. It is not a substitute for professional advice or services. Any actions you take based on the information provided here are strictly at your own risk. You accept full responsibility for any decisions or outcomes arising from your use of this website and agree to release us from any liability in connection with your use of, or reliance upon, the content or products found herein.