
|
Bill.com Holdings, Inc. (Bill) DCF -Bewertung |
Fully Editable: Tailor To Your Needs In Excel Or Sheets
Professional Design: Trusted, Industry-Standard Templates
Investor-Approved Valuation Models
MAC/PC Compatible, Fully Unlocked
No Expertise Is Needed; Easy To Follow
Bill.com Holdings, Inc. (BILL) Bundle
Entdecken Sie den wahren Wert von Bill.com Holdings, Inc. (Bill) mit unserem fortschrittlichen DCF -Taschenrechner! Passen Sie die wichtigsten Annahmen an, erkunden Sie verschiedene Szenarien und bewerten Sie die Auswirkungen von Änderungen auf die Bewertung von Bill.com Holdings, Inc. (Bill) - alles innerhalb einer umfassenden Excel -Vorlage.
What You Will Receive
- Pre-Filled Financial Model: Bill.com's actual data facilitates accurate DCF valuation.
- Full Forecast Control: Modify revenue growth, profit margins, WACC, and other essential drivers.
- Instant Calculations: Real-time updates provide immediate results as you adjust inputs.
- Investor-Ready Template: A polished Excel file crafted for high-quality valuation presentations.
- Customizable and Reusable: Designed for versatility, enabling repeated use for comprehensive forecasts.
Key Features
- Comprehensive Financial Data: Gain access to precise pre-loaded historical data and future forecasts for Bill.com Holdings, Inc. (BILL).
- Adjustable Forecast Parameters: Modify highlighted cells for key metrics such as WACC, growth rates, and profit margins.
- Real-Time Calculations: Instant updates for DCF, Net Present Value (NPV), and cash flow assessments.
- User-Friendly Dashboard: Intuitive charts and summaries to clearly present your valuation insights.
- Suitable for All Skill Levels: Designed with a straightforward layout for investors, CFOs, and consultants alike.
How It Works
- Step 1: Download the Excel file for Bill.com Holdings, Inc. (BILL).
- Step 2: Review the pre-filled financial data and forecasts for Bill.com.
- Step 3: Adjust key inputs such as revenue growth, WACC, and tax rates (highlighted cells).
- Step 4: Observe the DCF model refresh in real-time as you modify assumptions.
- Step 5: Evaluate the outputs and leverage the results for your investment strategies.
Why Choose This Calculator for Bill.com Holdings, Inc. (BILL)?
- Accurate Data: Up-to-date Bill.com financials provide dependable valuation outcomes.
- Customizable: Modify essential parameters such as growth rates, WACC, and tax rates to align with your forecasts.
- Time-Saving: Built-in calculations save you from starting from the ground up.
- Professional-Grade Tool: Tailored for investors, analysts, and financial consultants.
- User-Friendly: Easy-to-navigate layout and clear instructions make it accessible for all users.
Who Should Use This Product?
- Financial Analysts: Create comprehensive financial models to assess the performance of Bill.com Holdings, Inc. (BILL).
- Accounting Professionals: Evaluate billing and payment processes to enhance client financial strategies.
- Business Consultants: Offer precise valuation recommendations for clients interested in Bill.com Holdings, Inc. (BILL).
- Students and Educators: Utilize real-time data to learn and teach about financial technology and its impact on businesses.
- Investors: Gain insights into the valuation metrics of fintech companies like Bill.com Holdings, Inc. (BILL).
What the Template Contains
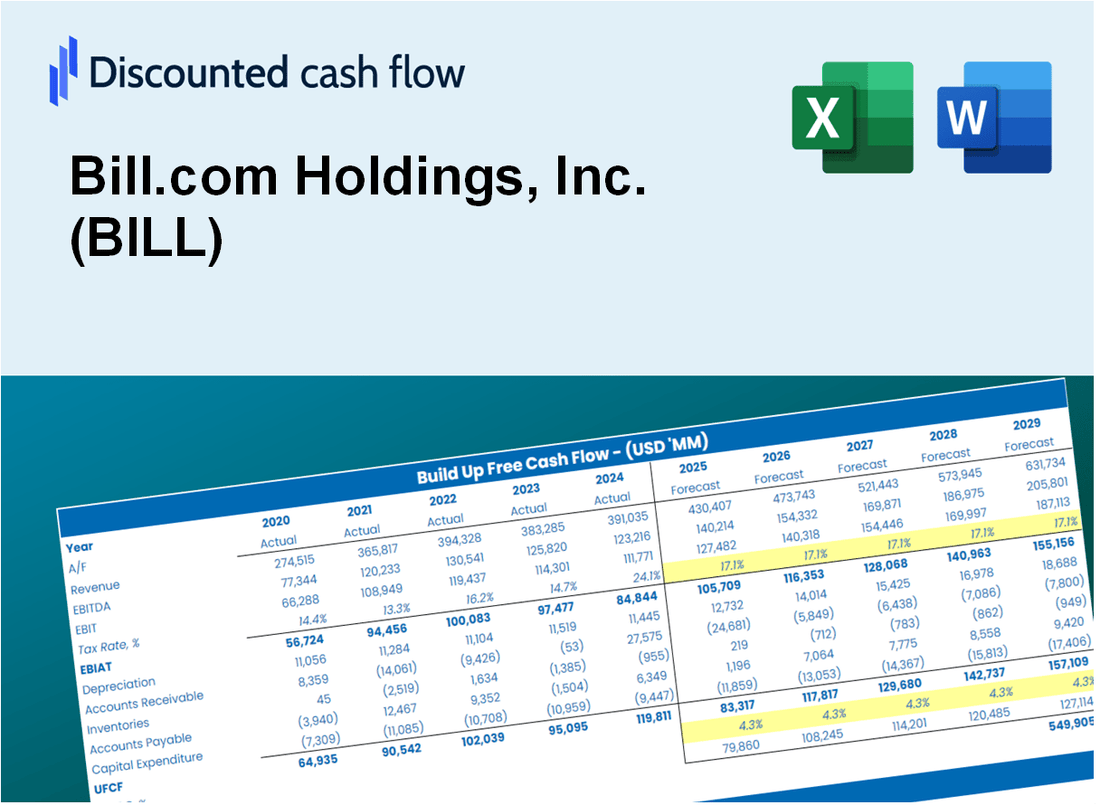
- Preloaded BILL Data: Historical and projected financial data, including revenue, EBIT, and capital expenditures.
- DCF and WACC Models: Professional-grade sheets for calculating intrinsic value and Weighted Average Cost of Capital.
- Editable Inputs: Yellow-highlighted cells for adjusting revenue growth, tax rates, and discount rates.
- Financial Statements: Comprehensive annual and quarterly financials for deeper analysis.
- Key Ratios: Profitability, leverage, and efficiency ratios to evaluate performance.
- Dashboard and Charts: Visual summaries of valuation outcomes and assumptions.
Disclaimer
All information, articles, and product details provided on this website are for general informational and educational purposes only. We do not claim any ownership over, nor do we intend to infringe upon, any trademarks, copyrights, logos, brand names, or other intellectual property mentioned or depicted on this site. Such intellectual property remains the property of its respective owners, and any references here are made solely for identification or informational purposes, without implying any affiliation, endorsement, or partnership.
We make no representations or warranties, express or implied, regarding the accuracy, completeness, or suitability of any content or products presented. Nothing on this website should be construed as legal, tax, investment, financial, medical, or other professional advice. In addition, no part of this site—including articles or product references—constitutes a solicitation, recommendation, endorsement, advertisement, or offer to buy or sell any securities, franchises, or other financial instruments, particularly in jurisdictions where such activity would be unlawful.
All content is of a general nature and may not address the specific circumstances of any individual or entity. It is not a substitute for professional advice or services. Any actions you take based on the information provided here are strictly at your own risk. You accept full responsibility for any decisions or outcomes arising from your use of this website and agree to release us from any liability in connection with your use of, or reliance upon, the content or products found herein.