
|
BNP Paribas SA (BNP.PA) DCF -Bewertung |
Fully Editable: Tailor To Your Needs In Excel Or Sheets
Professional Design: Trusted, Industry-Standard Templates
Investor-Approved Valuation Models
MAC/PC Compatible, Fully Unlocked
No Expertise Is Needed; Easy To Follow
BNP Paribas SA (BNP.PA) Bundle
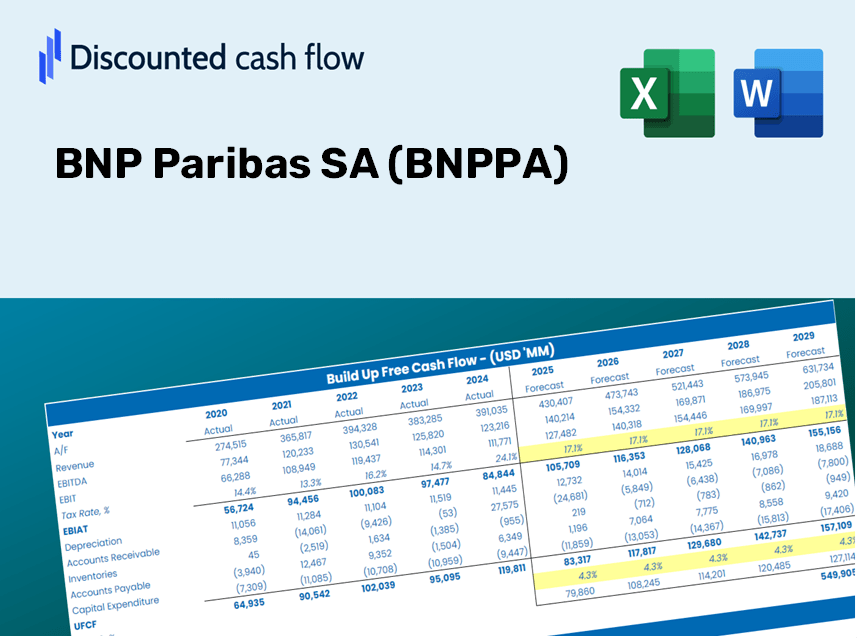
Gewinnen Sie mit unserem ausgefeilten DCF -Taschenrechner die Bewertungsanalyse für Ihre BNP Paribas SA (BNPPA) -Wundierungsanalyse! Mit dieser Excel -Vorlage können Sie mit echten BNPPA -Daten ausgestattet werden und können Prognosen und Annahmen für die genaue Bestimmung des inneren Wertes von BNP Paribas SA anpassen.
Discounted Cash Flow (DCF) - (USD MM)
| Year | AY1 2020 |
AY2 2021 |
AY3 2022 |
AY4 2023 |
AY5 2024 |
FY1 2025 |
FY2 2026 |
FY3 2027 |
FY4 2028 |
FY5 2029 |
|---|---|---|---|---|---|---|---|---|---|---|
| Revenue | 87,189.0 | 107,806.0 | 42,473.0 | 42,824.0 | 45,738.0 | 42,384.8 | 39,277.5 | 36,398.0 | 33,729.5 | 31,256.7 |
| Revenue Growth, % | 0 | 23.65 | -60.6 | 0.82641 | 6.8 | -7.33 | -7.33 | -7.33 | -7.33 | -7.33 |
| EBITDA | -4,069.0 | -4,445.0 | 19,679.0 | 17,970.0 | 23,460.0 | 11,087.7 | 10,274.8 | 9,521.5 | 8,823.5 | 8,176.6 |
| EBITDA, % | -4.67 | -4.12 | 46.33 | 41.96 | 51.29 | 26.16 | 26.16 | 26.16 | 26.16 | 26.16 |
| Depreciation | 2,256.0 | 2,336.0 | 6,465.0 | 6,245.0 | 7,272.0 | 4,277.3 | 3,963.7 | 3,673.1 | 3,403.8 | 3,154.3 |
| Depreciation, % | 2.59 | 2.17 | 15.22 | 14.58 | 15.9 | 10.09 | 10.09 | 10.09 | 10.09 | 10.09 |
| EBIT | -6,325.0 | -6,781.0 | 13,214.0 | 11,725.0 | 16,188.0 | 6,810.4 | 6,311.1 | 5,848.4 | 5,419.6 | 5,022.3 |
| EBIT, % | -7.25 | -6.29 | 31.11 | 27.38 | 35.39 | 16.07 | 16.07 | 16.07 | 16.07 | 16.07 |
| Total Cash | 816,005.0 | 484,267.0 | 474,919.0 | 296,611.0 | 786,013.0 | 42,384.8 | 39,277.5 | 36,398.0 | 33,729.5 | 31,256.7 |
| Total Cash, percent | .0 | .0 | .0 | .0 | .0 | .0 | .0 | .0 | .0 | .0 |
| Account Receivables | 37,028.0 | 42,739.0 | 52,184.0 | 50,798.0 | 48,597.0 | 32,391.6 | 30,016.9 | 27,816.3 | 25,777.0 | 23,887.2 |
| Account Receivables, % | 42.47 | 39.64 | 122.86 | 118.62 | 106.25 | 76.42 | 76.42 | 76.42 | 76.42 | 76.42 |
| Inventories | .0 | -400,778.0 | -384,098.0 | -347,409.0 | .0 | -25,430.9 | -23,566.5 | -21,838.8 | -20,237.7 | -18,754.0 |
| Inventories, % | 0 | -371.76 | -904.33 | -811.25 | 0 | -60 | -60 | -60 | -60 | -60 |
| Accounts Payable | .0 | 28,536.0 | 43,259.0 | .0 | .0 | 10,720.8 | 9,934.8 | 9,206.5 | 8,531.5 | 7,906.1 |
| Accounts Payable, % | 0 | 26.47 | 101.85 | 0 | 0 | 25.29 | 25.29 | 25.29 | 25.29 | 25.29 |
| Capital Expenditure | -773.0 | -1,664.0 | -2,529.0 | -2,216.0 | -2,136.0 | -1,545.3 | -1,432.0 | -1,327.0 | -1,229.7 | -1,139.6 |
| Capital Expenditure, % | -0.88658 | -1.54 | -5.95 | -5.17 | -4.67 | -3.65 | -3.65 | -3.65 | -3.65 | -3.65 |
| Tax Rate, % | 27.8 | 27.8 | 27.8 | 27.8 | 27.8 | 27.8 | 27.8 | 27.8 | 27.8 | 27.8 |
| EBITAT | -4,787.3 | -5,048.5 | 9,848.0 | 10,975.0 | 11,688.0 | 5,318.5 | 4,928.6 | 4,567.3 | 4,232.4 | 3,922.1 |
| Depreciation | ||||||||||
| Changes in Account Receivables | ||||||||||
| Changes in Inventories | ||||||||||
| Changes in Accounts Payable | ||||||||||
| Capital Expenditure | ||||||||||
| UFCF | -40,332.3 | 419,226.5 | 2,382.0 | -63,558.0 | -328,384.0 | 60,407.6 | 7,184.6 | 6,657.9 | 6,169.8 | 5,717.5 |
| WACC, % | 6.95 | 6.85 | 6.86 | 8.35 | 6.68 | 7.14 | 7.14 | 7.14 | 7.14 | 7.14 |
| PV UFCF | ||||||||||
| SUM PV UFCF | 76,788.7 | |||||||||
| Long Term Growth Rate, % | 2.00 | |||||||||
| Free cash flow (T + 1) | 5,832 | |||||||||
| Terminal Value | 113,498 | |||||||||
| Present Terminal Value | 80,401 | |||||||||
| Enterprise Value | 157,190 | |||||||||
| Net Debt | 71,849 | |||||||||
| Equity Value | 85,341 | |||||||||
| Diluted Shares Outstanding, MM | 1,133 | |||||||||
| Equity Value Per Share | 75.30 |
What You Will Receive
- Customizable Excel Template: A fully adjustable Excel-based DCF Calculator featuring pre-populated financial data for BNP Paribas SA (BNPPA).
- Actual Financial Data: Access to historical records and future projections (highlighted in the yellow cells).
- Forecast Customization: Modify key assumptions such as revenue growth, EBITDA margin, and WACC.
- Real-Time Calculations: Instantly observe how your inputs affect BNP Paribas SA's (BNPPA) valuation.
- Professional-Grade Tool: Designed for investors, CFOs, consultants, and financial analysts.
- Intuitive Design: Organized for clarity and ease of use, complete with step-by-step guidance.
Key Features
- Pre-Loaded Data: Comprehensive historical financial statements and pre-filled forecasts for BNP Paribas SA (BNPPA).
- Fully Adjustable Inputs: Customize WACC, tax rates, revenue growth, and EBITDA margins to suit your analysis.
- Instant Results: Watch BNP Paribas SA's (BNPPA) intrinsic value update in real time.
- Clear Visual Outputs: Interactive dashboard charts showcase valuation outcomes and essential metrics.
- Built for Accuracy: A reliable tool designed for analysts, investors, and finance professionals.
How It Works
- Step 1: Download the Excel file.
- Step 2: Review BNP Paribas SA’s (BNPPA) pre-filled financial data and projections.
- Step 3: Adjust key inputs such as revenue growth, WACC, and tax rates (highlighted cells).
- Step 4: Observe the DCF model update in real-time as you modify your assumptions.
- Step 5: Evaluate the outputs to inform your investment decisions.
Why Opt for This Calculator?
- Designed for Experts: A sophisticated tool utilized by financial analysts, CFOs, and consultants.
- Up-to-Date Data: BNP Paribas SA’s historical and projected financials preloaded for precision.
- Scenario Analysis: Effortlessly test various forecasts and assumptions.
- Comprehensive Outputs: Automatically computes intrinsic value, NPV, and essential metrics.
- User-Friendly: Step-by-step instructions lead you through each stage of the process.
Who Can Benefit from This Product?
- Finance Students: Master valuation methodologies and apply them using actual market data.
- Academics: Integrate advanced models into your teaching or research initiatives.
- Investors: Validate your investment theories and examine valuation metrics for BNP Paribas SA (BNPPA).
- Analysts: Enhance your productivity with a ready-to-use, customizable DCF model.
- Small Business Owners: Discover how major public firms like BNP Paribas SA (BNPPA) are evaluated in the financial landscape.
What the Template Includes
- Pre-Filled Data: Contains BNP Paribas SA’s historical financials and forecasts.
- Discounted Cash Flow Model: Editable DCF valuation model with automated calculations.
- Weighted Average Cost of Capital (WACC): A dedicated sheet for calculating WACC based on user-defined inputs.
- Key Financial Ratios: Assess BNP Paribas SA’s profitability, efficiency, and leverage.
- Customizable Inputs: Easily modify revenue growth, margins, and tax rates.
- Clear Dashboard: Visual representations and tables summarizing essential valuation outcomes.
Disclaimer
All information, articles, and product details provided on this website are for general informational and educational purposes only. We do not claim any ownership over, nor do we intend to infringe upon, any trademarks, copyrights, logos, brand names, or other intellectual property mentioned or depicted on this site. Such intellectual property remains the property of its respective owners, and any references here are made solely for identification or informational purposes, without implying any affiliation, endorsement, or partnership.
We make no representations or warranties, express or implied, regarding the accuracy, completeness, or suitability of any content or products presented. Nothing on this website should be construed as legal, tax, investment, financial, medical, or other professional advice. In addition, no part of this site—including articles or product references—constitutes a solicitation, recommendation, endorsement, advertisement, or offer to buy or sell any securities, franchises, or other financial instruments, particularly in jurisdictions where such activity would be unlawful.
All content is of a general nature and may not address the specific circumstances of any individual or entity. It is not a substitute for professional advice or services. Any actions you take based on the information provided here are strictly at your own risk. You accept full responsibility for any decisions or outcomes arising from your use of this website and agree to release us from any liability in connection with your use of, or reliance upon, the content or products found herein.