
|
BIOGE TECHNOLOGIES, Inc. (BSGM) DCF -Bewertung |
Fully Editable: Tailor To Your Needs In Excel Or Sheets
Professional Design: Trusted, Industry-Standard Templates
Investor-Approved Valuation Models
MAC/PC Compatible, Fully Unlocked
No Expertise Is Needed; Easy To Follow
BioSig Technologies, Inc. (BSGM) Bundle
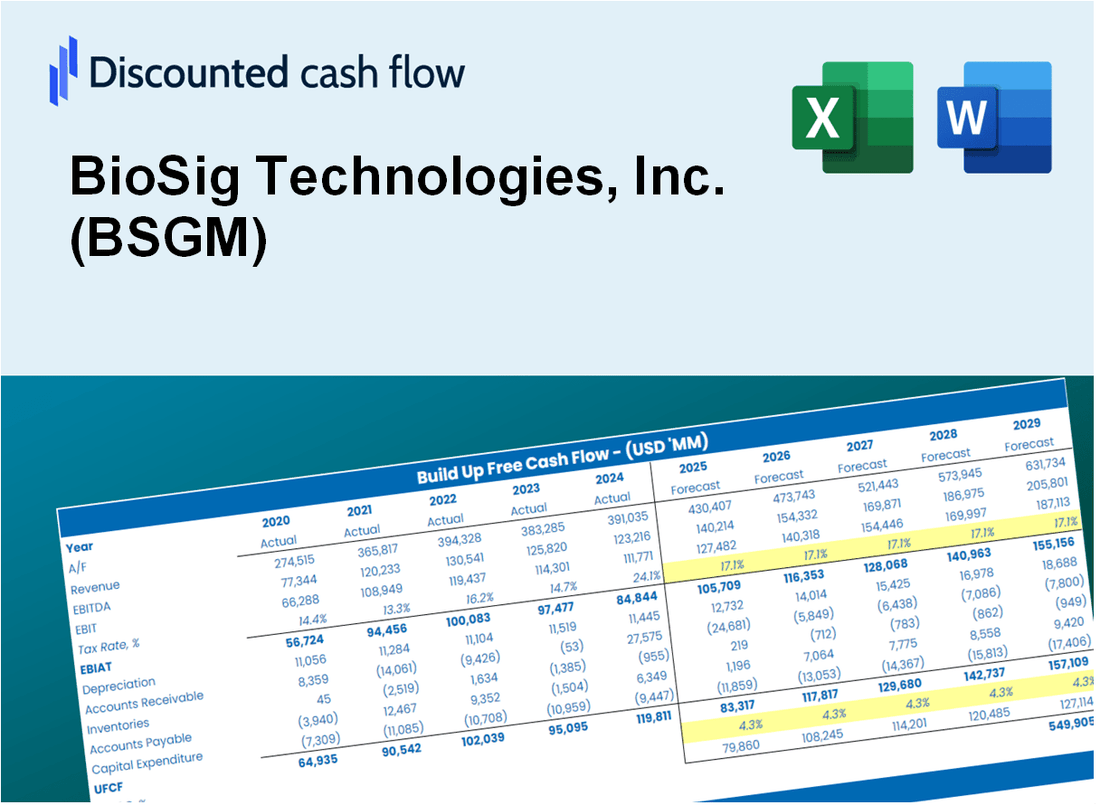
Gewinnen Sie einen Einblick in Ihre BIOSIG TECHNOLOGIES, Inc. (BSGM) Bewertungsanalyse unter Verwendung unseres modernsten DCF-Taschenrechners! Diese Excel -Vorlage wird mit realen BSGM -Daten vorinstalliert, sodass Sie Prognosen und Annahmen anpassen können, um den inneren Wert von Biosig Technologies, Inc. genau zu bestimmen.
What You Will Receive
- Comprehensive Financial Model: BioSig Technologies' actual data provides an accurate DCF valuation.
- Complete Forecasting Control: Modify revenue growth, profit margins, WACC, and other essential drivers.
- Real-Time Calculations: Automatic updates allow you to view results immediately as you adjust parameters.
- Professional-Grade Template: A polished Excel file crafted for high-quality valuation presentations.
- Flexible and Reusable: Designed for adaptability, enabling repeated use for in-depth forecasts.
Key Features
- Cutting-Edge Signal Processing Technology: Leverages advanced algorithms for precise cardiac signal analysis.
- Comprehensive Data Analytics: Offers in-depth insights into cardiac procedures with customizable reporting tools.
- User-Friendly Interface: Intuitive design allows for easy navigation and efficient data management.
- Real-Time Monitoring: Provides instant feedback during procedures to enhance patient outcomes.
- Robust Compliance Features: Ensures adherence to industry regulations and standards for medical devices.
How It Works
- Step 1: Download the Excel file.
- Step 2: Review pre-entered BioSig Technologies data (historical and projected).
- Step 3: Adjust key assumptions (yellow cells) based on your analysis.
- Step 4: View automatic recalculations for BioSig Technologies’ intrinsic value.
- Step 5: Use the outputs for investment decisions or reporting.
Why Choose This Calculator for BioSig Technologies, Inc. (BSGM)?
- Designed for Experts: A sophisticated tool tailored for healthcare analysts, financial officers, and industry consultants.
- Comprehensive Data: BioSig's historical and projected financial data preloaded for enhanced precision.
- Flexible Scenario Analysis: Effortlessly test various forecasts and assumptions to gauge potential outcomes.
- Insightful Results: Automatically computes intrinsic value, NPV, and essential financial metrics.
- User-Friendly: Step-by-step guidance ensures a smooth and straightforward experience.
Who Should Use This Product?
- Individual Investors: Make informed decisions about buying or selling BioSig Technologies stock (BSGM).
- Financial Analysts: Streamline valuation processes with ready-to-use financial models specific to BioSig Technologies (BSGM).
- Consultants: Deliver professional valuation insights for BioSig Technologies (BSGM) to clients quickly and accurately.
- Business Owners: Understand how innovative companies like BioSig Technologies (BSGM) are valued to guide your own strategy.
- Finance Students: Learn valuation techniques using real-world data and scenarios related to BioSig Technologies (BSGM).
What the Template Contains
- Pre-Filled Data: Includes BioSig Technologies, Inc.'s (BSGM) historical financials and projections.
- Discounted Cash Flow Model: Editable DCF valuation model with automatic calculations.
- Weighted Average Cost of Capital (WACC): A dedicated sheet for calculating WACC based on custom inputs.
- Key Financial Ratios: Analyze BioSig Technologies, Inc.'s (BSGM) profitability, efficiency, and leverage.
- Customizable Inputs: Edit revenue growth, margins, and tax rates with ease.
- Clear Dashboard: Charts and tables summarizing key valuation results.
Disclaimer
All information, articles, and product details provided on this website are for general informational and educational purposes only. We do not claim any ownership over, nor do we intend to infringe upon, any trademarks, copyrights, logos, brand names, or other intellectual property mentioned or depicted on this site. Such intellectual property remains the property of its respective owners, and any references here are made solely for identification or informational purposes, without implying any affiliation, endorsement, or partnership.
We make no representations or warranties, express or implied, regarding the accuracy, completeness, or suitability of any content or products presented. Nothing on this website should be construed as legal, tax, investment, financial, medical, or other professional advice. In addition, no part of this site—including articles or product references—constitutes a solicitation, recommendation, endorsement, advertisement, or offer to buy or sell any securities, franchises, or other financial instruments, particularly in jurisdictions where such activity would be unlawful.
All content is of a general nature and may not address the specific circumstances of any individual or entity. It is not a substitute for professional advice or services. Any actions you take based on the information provided here are strictly at your own risk. You accept full responsibility for any decisions or outcomes arising from your use of this website and agree to release us from any liability in connection with your use of, or reliance upon, the content or products found herein.