
|
BrightSphere Investment Group Inc. (BSIG) DCF -Bewertung |
Fully Editable: Tailor To Your Needs In Excel Or Sheets
Professional Design: Trusted, Industry-Standard Templates
Investor-Approved Valuation Models
MAC/PC Compatible, Fully Unlocked
No Expertise Is Needed; Easy To Follow
BrightSphere Investment Group Inc. (BSIG) Bundle
Entdecken Sie die finanziellen Aussichten der BrightSphere Investment Group Inc. (BSIG) mit unserem benutzerfreundlichen DCF-Taschenrechner! Geben Sie Ihre Prognosen für Wachstum, Margen und Kosten ein, um den inneren Wert der BrightSphere Investment Group Inc. (BSIG) zu berechnen und Ihren Investitionsansatz zu verbessern.
What You Will Get
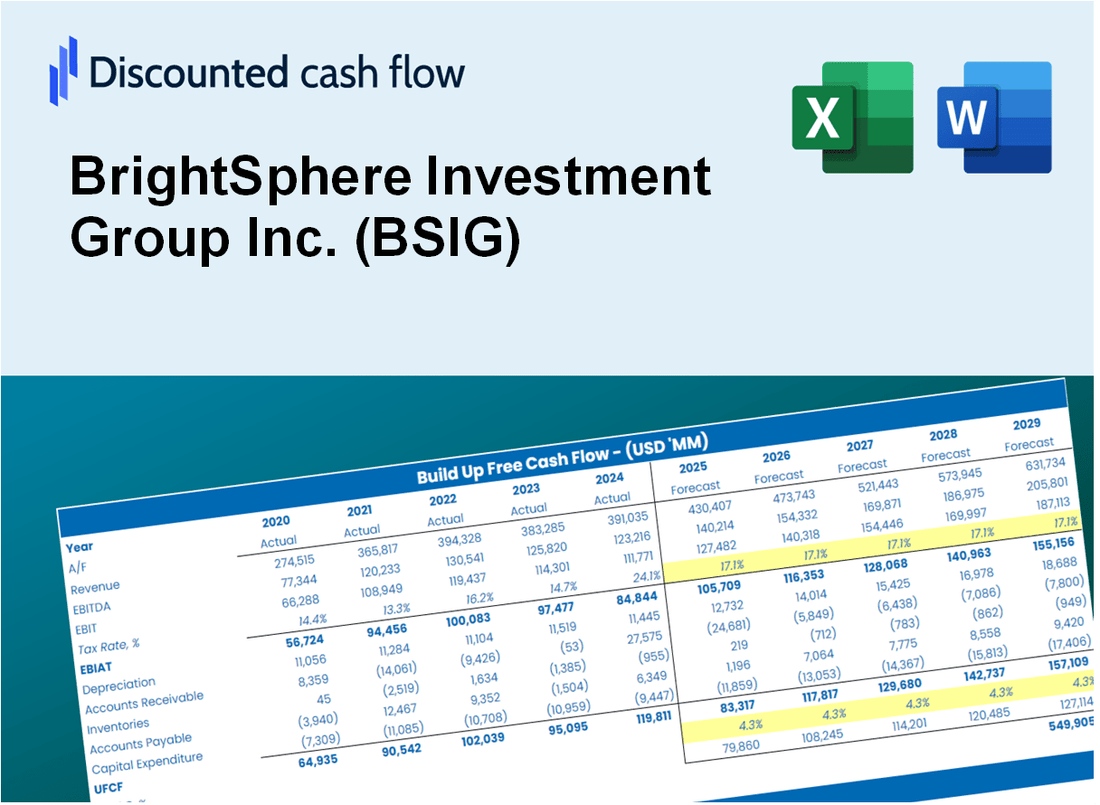
- Genuine BSIG Data: Preloaded financials – encompassing revenue to EBIT – derived from actual and projected figures.
- Complete Customization: Modify all key parameters (yellow cells) such as WACC, growth %, and tax rates.
- Instant Valuation Updates: Automatic recalibrations to assess the impact of changes on BrightSphere Investment Group Inc.'s (BSIG) fair value.
- Flexible Excel Template: Designed for quick modifications, scenario analysis, and comprehensive projections.
- Efficient and Precise: Avoid the hassle of building models from the ground up while ensuring accuracy and adaptability.
Key Features
- Comprehensive DCF Calculator: Offers detailed unlevered and levered DCF valuation models tailored for BrightSphere Investment Group Inc. (BSIG).
- WACC Calculator: Features a pre-constructed Weighted Average Cost of Capital sheet with adjustable inputs.
- Customizable Forecast Assumptions: Easily modify growth rates, capital expenditures, and discount rates to fit your analysis.
- Integrated Financial Ratios: Evaluate profitability, leverage, and efficiency ratios specifically for BrightSphere Investment Group Inc. (BSIG).
- Interactive Dashboard and Charts: Visual representations summarize essential valuation metrics for straightforward analysis.
How It Works
- Step 1: Download the Excel file.
- Step 2: Review pre-entered BrightSphere Investment Group Inc. (BSIG) data (historical and projected).
- Step 3: Adjust key assumptions (yellow cells) based on your analysis.
- Step 4: View automatic recalculations for BrightSphere Investment Group Inc. (BSIG)’s intrinsic value.
- Step 5: Use the outputs for investment decisions or reporting.
Why Choose This Calculator for BrightSphere Investment Group Inc. (BSIG)?
- Accurate Data: Up-to-date BrightSphere financials provide trustworthy valuation outcomes.
- Customizable: Tailor key variables such as growth rates, WACC, and tax rates to align with your forecasts.
- Time-Saving: Pre-configured calculations help you avoid starting from the ground up.
- Professional-Grade Tool: Crafted for investors, analysts, and financial consultants.
- User-Friendly: Easy-to-navigate design and clear step-by-step guidance cater to users of all levels.
Who Should Use This Product?
- Individual Investors: Make informed decisions about investing in BrightSphere Investment Group Inc. (BSIG).
- Financial Analysts: Enhance valuation assessments with comprehensive financial models tailored for BSIG.
- Consultants: Provide clients with accurate valuation insights on BrightSphere Investment Group Inc. (BSIG) efficiently.
- Business Owners: Gain insights into the valuation of investment firms like BSIG to inform your own business strategies.
- Finance Students: Master valuation methods using real-time data and case studies involving BrightSphere Investment Group Inc. (BSIG).
What the Template Contains
- Comprehensive DCF Model: Editable template featuring detailed valuation calculations tailored for BrightSphere Investment Group Inc. (BSIG).
- Real-World Data: BrightSphere’s historical and projected financials preloaded for in-depth analysis.
- Customizable Parameters: Modify WACC, growth rates, and tax assumptions to evaluate various scenarios.
- Financial Statements: Complete annual and quarterly breakdowns for enhanced insights.
- Key Ratios: Integrated analysis focusing on profitability, efficiency, and leverage metrics.
- Dashboard with Visual Outputs: Charts and tables designed for clear, actionable results.
Disclaimer
All information, articles, and product details provided on this website are for general informational and educational purposes only. We do not claim any ownership over, nor do we intend to infringe upon, any trademarks, copyrights, logos, brand names, or other intellectual property mentioned or depicted on this site. Such intellectual property remains the property of its respective owners, and any references here are made solely for identification or informational purposes, without implying any affiliation, endorsement, or partnership.
We make no representations or warranties, express or implied, regarding the accuracy, completeness, or suitability of any content or products presented. Nothing on this website should be construed as legal, tax, investment, financial, medical, or other professional advice. In addition, no part of this site—including articles or product references—constitutes a solicitation, recommendation, endorsement, advertisement, or offer to buy or sell any securities, franchises, or other financial instruments, particularly in jurisdictions where such activity would be unlawful.
All content is of a general nature and may not address the specific circumstances of any individual or entity. It is not a substitute for professional advice or services. Any actions you take based on the information provided here are strictly at your own risk. You accept full responsibility for any decisions or outcomes arising from your use of this website and agree to release us from any liability in connection with your use of, or reliance upon, the content or products found herein.